General Discussion
Related: Editorials & Other Articles, Issue Forums, Alliance Forums, Region ForumsPolice Killings in 2015 so far (by State):
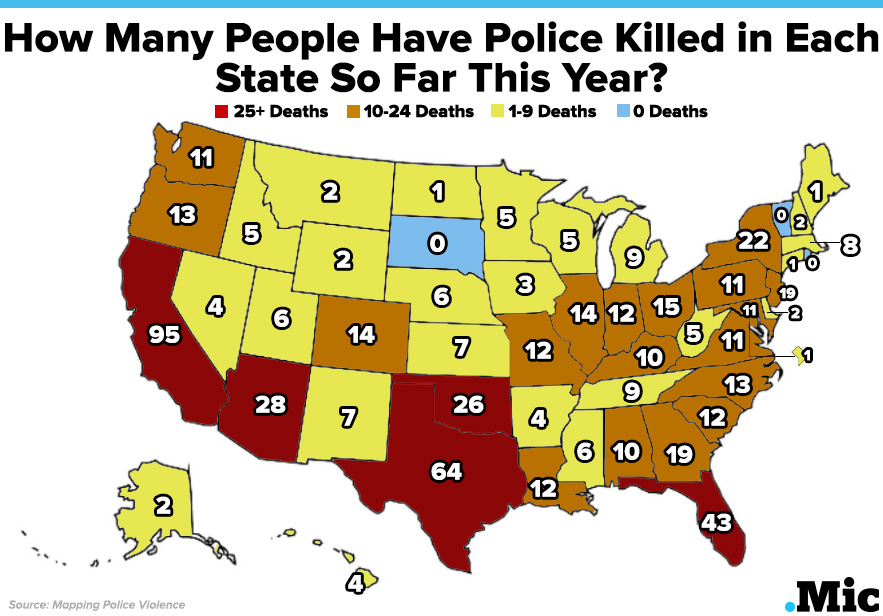
How Many People Police Have Killed in Each State So Far This Year
In 47 out of 50 states, American police officers have killed at least one person so far this year. In some, the number of officer-involved homicides dwarfs numbers from entire countries.
The map below, based on statistics the research collaborative Mapping Police Violence provided to Mic, shows all 605 deaths from police violence in the United States from Jan. 1 through July 10. As is evident, there's a clear correlation between population size and the number of slayings, but certain states still stand out with particularly large numbers.
http://mic.com/articles/122161/one-map-shows-all-the-people-police-have-killed-in-each-state-so-far-this-year
 = new reply since forum marked as read
Highlight:
NoneDon't highlight anything
5 newestHighlight 5 most recent replies
= new reply since forum marked as read
Highlight:
NoneDon't highlight anything
5 newestHighlight 5 most recent replies

randys1
(16,286 posts)but also so they can coordinate the killings in a more efficient manner.

Angry Dragon
(36,693 posts)Tierra_y_Libertad
(50,414 posts)
TBF
(32,139 posts)
Glassunion
(10,201 posts)Everyone forgets Rhode Island...
Tierra_y_Libertad
(50,414 posts)
IcyPeas
(21,940 posts)I didn't expect that.
Glassunion
(10,201 posts)TBF
(32,139 posts)the article links to another article from 2014 talking about police shootings and racism: http://www.usatoday.com/story/news/nation/2014/11/18/ferguson-black-arrest-rates/19043207/
Same thing with Texas. We are likely looking at higher numbers that include attempted drug arrests etc. Those numbers are of course going to be higher at the borders.
Once again the combination of capitalism and racism - huge systemic problems in this country.

JHB
(37,166 posts)Quick calculation of per million population:
Oklahoma 6.70
Arizona 4.16
Wyoming 3.42
New Mexico 3.36
Oregon 3.27
Nebraska 3.19
Idaho 3.06
Hawaii 2.82
Alaska 2.71
West Virginia 2.70
Colorado 2.61
Louisiana 2.58
South Carolina 2.48
California 2.45
Kansas 2.41
Texas 2.37
Kentucky 2.27
Florida 2.16
Delaware 2.14
New Jersey 2.13
Alabama 2.06
Utah 2.04
Mississippi 2.00
Missouri 1.98
Montana 1.95
Georgia 1.88
Maryland 1.84
Indiana 1.82
Washington 1.56
District of Columbia 1.52
New Hampshire 1.51
Nevada 1.41
Tennessee 1.37
North Dakota 1.35
Arkansas 1.35
Virginia 1.32
North Carolina 1.31
Ohio 1.29
Massachusetts 1.19
New York 1.11
Illinois 1.09
Iowa 0.97
Minnesota 0.92
Michigan 0.91
Wisconsin 0.87
Pennsylvania 0.86
Maine 0.75
Connecticut 0.28
Rhode Island 0.00
South Dakota 0.00
Vermont 0.00
Lizzie Poppet
(10,164 posts)So, to some degree, is my beloved Oregon. Mind you, we have a hell of a problem in the rural parts of the state with meth labs (and their often-violent operators), but without knowing where the police killings took place, I can't say if that's the major factor.
Rex
(65,616 posts)Of course being a native Texan, I already knew about how bad some Good Old Boys...er PDs are around here.
seveneyes
(4,631 posts)Where are the data?
TBF
(32,139 posts)such as this one from 2014: http://www.usatoday.com/story/news/nation/2014/11/18/ferguson-black-arrest-rates/19043207/ to give some background for their assertions.
I do think you have a legitimate point. As I said above in the thread we are likely seeing the drug arrest (or attempted arrests) in these numbers for sure - especially in the border states of California and Texas. Large populations, diversity, plenty of criminal activity going on. I can tell you here in Houston there are often stories of the officers who are shot (whether injured or killed) and many of them are just doing their job to the best of their ability. Not all of them are racists by any stretch.
I think ultimately you have to look at both the effects of capitalism (resulting poverty and all that entails with the extreme income inequality we're facing) and racism to have a clearer understanding of where we are in this country.