General Discussion
Related: Editorials & Other Articles, Issue Forums, Alliance Forums, Region ForumsUS productivity rate takes largest drop in a year
This could be a short-live blip but if it sets up a trend, it could be good news as it could signal a surge upwards in job creation.
One of the primary issues with jobs is that productivity in the US remains high... really high.
[img]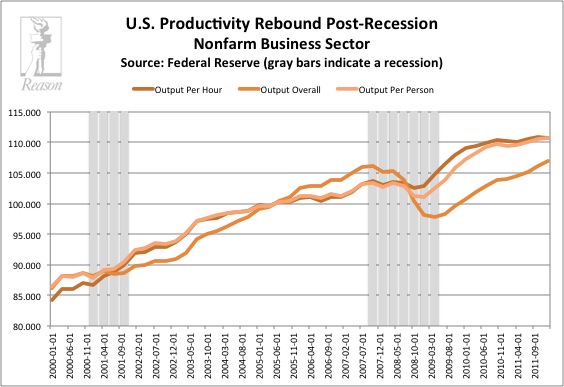 [/img]
More output per worker means less workers are needed.
So if productivity plummets, then more workers are needed to keep up with demand. This is why corporations don't like mandated shorter work weeks, required breaks per shift, over-time pay, increased vacation pay, sick leave or holidays. All of the aforementioned lower productivity, unless of course, you're an executive.
This is also why they don't like unions. Unions keep productivity in check by disallowing employers to working their employees like rented mules.
http://economywatch.msnbc.msn.com/_news/2012/06/06/12084358-us-productivity-rate-takes-largest-drop-in-a-year?lite
y msnbc.com staff and news wires
The productivity of American workers dropped at the fastest pace in a year in the first quarter, the Labor Department reported Wednesday, underscoring how difficult it has become for U.S. businesses to squeeze more work out of current staffing levels.
Non-farm productivity decreased at a 0.9 percent annual pace in January through March. That's faster than the initial estimate of an annual rate of decline of 0.5 percent and the consensus estimate of economists polled by Reuters who were expecting productivity to decline at a 0.7 percent rate.
------snip------
 = new reply since forum marked as read
Highlight:
NoneDon't highlight anything
5 newestHighlight 5 most recent replies
= new reply since forum marked as read
Highlight:
NoneDon't highlight anything
5 newestHighlight 5 most recent replies

JDPriestly
(57,936 posts)for what is being produced? That would suggest a loss in jobs, not a gain, wouldn't it? I think this reduction in productivity may actually be due to increased income disparity and less money spent by the middle class and poor.

Enrique
(27,461 posts)it's not obvious to me.

cthulu2016
(10,960 posts)I wish this chart used three more different colors because it is easy to misread the huge drop in total production where the top line becomes the bottom line.
The story told by the chart is this:
1) Economy exploded and a bunch of people got fired. Fewer employees and less production.
2) Business started increasing productivity per remaining worker (think of whipping a mule) so production picked up, but employment did not. Businesses earned to get the same output from fewer workers.
3) The usefulness of whipping started to reach its maximum. The increase of production/worker will remain in the economy but for production to increase further would require more workers.
Now the trick is to get production up, which means getting demand up, which means a need for economic growth.
Enrique
(27,461 posts)a crappy economy, bosses figure they can squeeze their workers and the workers will have to take it because of the crappy economy. Thus the bosses lay off people not because of less work but because they can get the same work out of fewer people. And so unemployment rates go up, along with corporate profits, both of which we have been seeing.
By the way, the squeezing is sometimes illegal, for example wage and hour violations, but the Labor department doesn't have anywhere near the manpower to do anything about it.