Welcome to DU!
The truly grassroots left-of-center political community where regular people, not algorithms, drive the discussions and set the standards.
Join the community:
Create a free account
Support DU (and get rid of ads!):
Become a Star Member
Latest Breaking News
General Discussion
The DU Lounge
All Forums
Issue Forums
Culture Forums
Alliance Forums
Region Forums
Support Forums
Help & Search
General Discussion
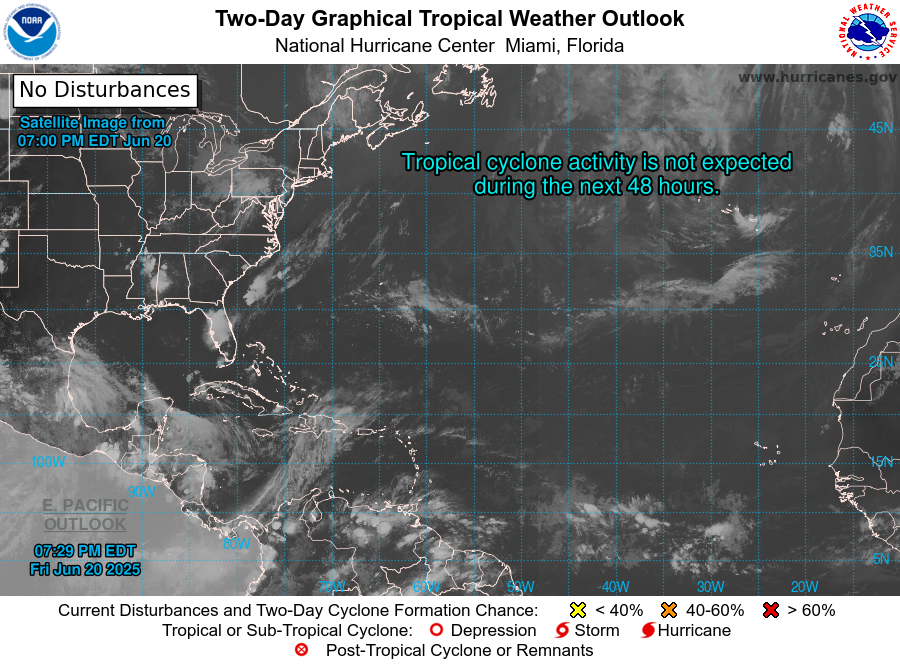
Related: Editorials & Other Articles, Issue Forums, Alliance Forums, Region ForumsOK DUers there is a 70% chance of a system forming in the 'Effin Central Atlantic - update -now TD#1
Last edited Wed Apr 19, 2017, 10:46 AM - Edit history (1)

From NOAA
Special Tropical Weather Outlook
NWS National Hurricane Center Miami FL
825 AM EDT Wed Apr 19 2017
For the North Atlantic...Caribbean Sea and the Gulf of Mexico:
in 48 hours
1. A non-tropical low pressure system is located over the central
Atlantic a little more than 700 miles southwest of the Azores.
There has been a small increase in organization during the past few
hours, and a subtropical depression is likely to form later today
before the system becomes absorbed by a larger extratropical
cyclone on Thursday. The next Special Tropical Weather Outlook will
be issued by 2 PM EDT this afternoon unless advisories have already
been initiated. For additional information on this system, please
see High Seas Forecasts issued by the National Weather Service.
* Formation chance through 48 hours...high...70 percent
* Formation chance through 5 days...high...70 percent
High Seas Forecasts issued by the National Weather Service can be
found under AWIPS header NFDHSFAT1, WMO header FZNT01 KWBC, and on
the Web at http://www.opc.ncep.noaa.gov/shtml/NFDHSFAT1.shtml.
Forecaster Avila
--------------------------
It is mid-April - this is the Atlantic - remember there is no Climate Change
InfoView thread info, including edit history
TrashPut this thread in your Trash Can (My DU » Trash Can)
BookmarkAdd this thread to your Bookmarks (My DU » Bookmarks)
19 replies, 4623 views
ShareGet links to this post and/or share on social media
AlertAlert this post for a rule violation
PowersThere are no powers you can use on this post
EditCannot edit other people's posts
ReplyReply to this post
EditCannot edit other people's posts
Rec (10)
ReplyReply to this post
19 replies
 = new reply since forum marked as read
Highlight:
NoneDon't highlight anything
5 newestHighlight 5 most recent replies
OK DUers there is a 70% chance of a system forming in the 'Effin Central Atlantic - update -now TD#1 (Original Post)
malaise
Apr 2017
OP
JHan
(10,173 posts)1. what the ever living fuck?
The fuck, it's april?!?
Achilleaze
(15,543 posts)2. and the republicans weasel out of the Paris climate meeting...
what planetary-scale idiotic a-holery on the part of the frikken carbon-belching KGOP, Inc. against the people of America and the world.
deplorable.
malaise
(268,931 posts)6. It's now Tropical Depression #1
https://www.wunderground.com/hurricane/atlantic/2017/Tropical-Depression-One
The good news NNE - may catch up with Nunes in the Azores
The good news NNE - may catch up with Nunes in the Azores
JHan
(10,173 posts)7. this is my expression right now:

April..... April.
malaise
(268,931 posts)9. Bwaaaaaaaaaaah hahahahahaha
Phoenix61
(17,002 posts)3. That's really, really not a good sign
Way too early. Obviously has nothing to do with climate change.![]()
LongTomH
(8,636 posts)4. It just keeps getting worse!
malaise
(268,931 posts)10. Remember that last yearthe first one was in January
superpatriotman
(6,247 posts)5. Just had my flat roofs redone
Just in time, it seems.
malaise
(268,931 posts)13. Well if it survives it may be the Canadian
Maritimes. Some lousy weather is heading somewhere. There is near Tropical Storm strength
![]()
![]()
Quackers
(2,256 posts)8. Kick. nt
Quackers
(2,256 posts)11. Found this chart on past hurricane counts. 1851-2015
Total and Average Number of Tropical Cylones by Month
(1851-2015)
Month Tropical Storms Hurricanes U.S. Landfalling
Hurricanes
Total Average Total Average Total Average
JANUARY 2 * 1 * 0 *
FEBRUARY 1 * 0 * 0 *
MARCH 1 * 1 * 0 *
APRIL 1 * 0 * 0 *
MAY 21 0.1 4 * 0 *
JUNE 87 0.5 33 0.2 19 0.12
JULY 118 0.7 55 0.3 25 0.15
AUGUST 378 2.3 238 1.4 77 0.48
SEPTEMBER 571 3.5 395 2.4 107 0.67
OCTOBER 336 2.0 201 1.2 53 0.33
NOVEMBER 89 0.5 58 0.3 5 0.03
DECEMBER 17 0.1 6 * 0 *
YEAR 1619 9.9 991 6.0 284 1.73
http://www.aoml.noaa.gov/hrd/tcfaq/E17.html
malaise
(268,931 posts)12. Very rare
B2G
(9,766 posts)19. This isn't a hurricane
Any data on TDs?
Blue_Tires
(55,445 posts)14. I ain't skeert...
I'm more worried about climate change than this particular storm
Blue_Tires
(55,445 posts)16. True....
But I don't think this storm is going anywhere near you anyway...
malaise
(268,931 posts)18. It's now tropical storm Arlene
Hehehehhe - not coming near me