Western PA Union Dems
I'm not a dissident labor member, but this has to be said.
We're a pro-union stronghold, with a long and storied labor tradition, which continues up to present times. There have been a ton of demonstrations, well attended by the rank and file, supported by a large number of labor unions around here in the last year and a half. We're also still a rust-belt area.
But we lost every county on our end of the PA 'T' to the repugs, and we effectively lost 2 Dem congressional seats. (Altmire Critz district consolidation followed by Rothfus victory.) The ship is starting to sale, to an ugly repug port.
I could name good activist people from Transit workers, Ironworkers, Steelworkers, Sprinkler fitters, Steamfitters, SEIU, CLUW, IBEW, IUOE. AFSCME, AFT. There are good people from the Postal Workers, CWA, UNITE, HERE, Carpenters, Laborers, who I've seen out at events, whose names I don't know, but I recognize their faces.
Why is it so hard to harness the energy that Trumka and Hill called for in Philly, to keep our end of PA blue? I've seen that energy at work here in Pittsburgh. I don't want Shea and Vinski's job, or my IBEW local's organizers' job. I don't want one cent off the unions. But if the state or national/Int'l wants any after action reports or free advice, I'd be more than happy to offer it. It's a shame that we continue to be eroded by anti-union Mellon repug interests, and continue to stay the course, but when free advice is offered, it's valued by the labor organizer heirarchy based on its sticker price.
Here's a simple bit of advice, or axiom: Trying to organize the rank and file by saying 'pay us, come work for us for free, shut up and do what we say' is not a winning formula for striking a spark among labor.
By staying the course here, we're engaging in a sitzkrieg.
 = new reply since forum marked as read
Highlight:
NoneDon't highlight anything
5 newestHighlight 5 most recent replies
= new reply since forum marked as read
Highlight:
NoneDon't highlight anything
5 newestHighlight 5 most recent replies

John1956PA
(2,654 posts)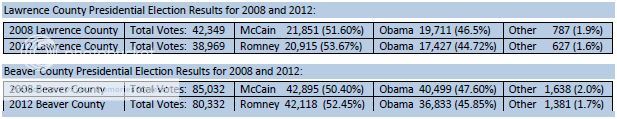
I am from the area and was raised in a union household. I have relatives who are union members, and I discuss with them the swing away from union sentiment in these two counties.

Mc Mike
(9,111 posts)For 2004 Beaver County, the Post-Gazette (Wed., 11/3/04, p. A-24) reported bush -- 37,041 (47.7%), Kerry -- 40,121 (51.7%).
For both 2012 Lawrence and 2008 Lawrence, CNN results had Lawrence going for Obama. I can't give you a screen capture for CNN's site map on Wed. morning (9 - 10 a.m., 11/7/12), but it showed Allegheny and Lawrence blue, then later that day the NY Times site map showed Lawrence red. The P-G reported (Wed., 11/5/08, p. A-15, from CNN's unofficial results as of 12:30 a.m.), with estimated 97% of PA precincts reporting in, that Lawrence went blue for Obama. (I have hard copies of all the Post-Gazette reporting, for '04, '08, '12.) Their '08 reporting claimed that 21,969 represented 68% of total voters in Lawrence, which would make 100% of voters 32,307. Their vote total report of '32,307' is a reporting 'error' on their part which rubs out better than 10,000 votes from your more accurate (in my assessment) 2008 "Total Votes: 42,349" figure. (42,349 - 32,307 is 10,042. That would mean 23.7% (not 32%) of the vote was still outstanding and not reported, and 76.3% of the vote was 'in' and reported.)
So the P-G and CNN are wrong in one of two ways, either in their statement of total reported voter numbers, or in their statment of total reported vote percentages. If '68%' is right, then 42,349 X 68% is 28,797, so they 'lost' 6,828 voters in their coverage by wrongly claiming that there were '21,969 reported voters' officially turned in. 6,828/42,349 equals 16.1% of Lawrence voters missing. Or the '21,969' figure is right, and 21,969/42,349 means they're saying that elections officials are 'reporting' 51.88% of the voters, not '68%'. And 68% - 51.88% is 16.1%. Either way, their 'reporting' on 'election results reports' is missing an actual 16.1% of Lawrence voters. That's a big number and percentage of 'error', and shows where the lie about a 'red shift' for Lawrence is hidden., by corporate media reporting and vote counting/reporting officials, cutting a deal with repug power figures. A spark from labor, civil rights, and women's rights groups would prevent that easy theft.
The P-G reported for '04 (Sun. 11/7/04, p. A-1, A-15) that 'Red counties get redder, blue ones get bluer', and with a CNN, evote.com, PA Dept. of State compiled map, the newspaper showed the difference between 2000 and 2004. In 2000, Lawrence, Beaver, Allegheny, Washington, Fayette, and Greene all went blue. In '04, Beaver, Allegheny, Washington, and Fayette went blue, and we allegedly 'lost' Lawrence and Greene to the red. So their map contradicted their reporting, with regards to Lawrence & Greene (and Mercer and Cambria too); they smoothed over or obscured an 'officially reported' red shift.
The December '07 'Pennsylvania Manual' reports (pp. 7-90, 7-91) these voter registration numbers for the '04 Presidential election year:
Lawrence -- 32,881 Dem, 21,995 R.
Armstrong -- 20,442 Dem, 20,739 R.
Beaver -- 73,401 Dem, 37,538 R.
Allegheny -- 557,900 D, 262,692 R.
Westmoreland -- 142,979 D, 88,727 R.
Washington -- 88,941 D, 47,351 R.
Fayette -- 61,475 D, 21,421 R.
Greene --17,151 D, 6,514 R.
Mercer -- 36,745 D, 31,626 R.
Indiana -- 23,770 D, 23,699 R.
Cambria -- 56,390 D, 28,849 R.
Call it 8 counties in our western under arm of the 'T' where we should be way ahead or strongly competitive, and add 3 to the north and east where it's the same. It's getting stolen, here in Western PA. It's not labor's fault that this is happening, but labor is a big reason why we're Dems, and ahead or strongly competitive. Being 'rusty' should just make us more driven, determined and adament, not resigned and beaten down.
Somebody's blog that I read on Wed. (Maddow, Brad, TalkingPointsMemo) pointed out that Dems cast 2.74 million votes for Dem Congressional candidates in PA this year, with 2.67 million votes cast for the repugs, and that you would think we had 9 or 10 of the 18 Congressional districts owned by the Dems as a result of that vote. Unfortunately, repug gerrymandering means that we won only 5 Federal Congressional rep slots.
On edit, added that the P-G (11/7/12, p. B-4) reported 32,178 as 91% of the Lawrence voter total, meaning 35,360 'is' 100%. Your total number of 38,969 for Lawrence 2012 shows there are 3609 'missing' voters in the P-G's reporting on the election officials' report, so 9.26% of the vote is missing.