Environment & Energy
Related: About this forum
 = new reply since forum marked as read
Highlight:
NoneDon't highlight anything
5 newestHighlight 5 most recent replies
= new reply since forum marked as read
Highlight:
NoneDon't highlight anything
5 newestHighlight 5 most recent replies

progree
(10,904 posts)after I got done posting the World one at https://www.democraticunderground.com/1127126127#post2 (which is year 2011), thinking the U.S. one would be more up to date, but the thought disappeared out of my head.
Interesting that in the U.S. that wind is almost equal to nuclear in electrical output:
Nuclear: primary energy input: 8.44 quads. But at say 35% conversion efficiency, is just 2.95 quads electrical
Wind: primary energy input: 2.53 quads -- I believe that's also the actual electrical output to the grid.
HUGE EDIT: no I'm wrong in the above -- the wind 2.53 quads is not the electrical output but rather an inflated figure to represent a fuel equivalent as if the "fuel" is burned in a typical fossil fuel plant . The fine print below the diagram says:
====================================================
By the way, I didn't mean to suggest you shouldn't have posted the one about the Ohio Repubs trying to subsidize nuclear more than wind/solar because one such article has been already posted earlier -- after all "duplicates" are allowed everywhere except in LBN -- I just thought it looked familiar and had some different content that might be of interest to some.
https://www.democraticunderground.com/1127126124
mr_lebowski
(33,643 posts)progree
(10,904 posts)that the nuclear, coal, and other thermal fuels' quads on the far left are the actual thermal quads of the fuel consumed
while the wind, solar etc. quads are some fuel equivalent as if it was then to be burned in a typical fossil fuel power plant ....
I was in the process of editing my post#1 when I saw your comment ...
From the fine print below the diagram (an expanded version is in post#1):

OKIsItJustMe
(19,938 posts)We’ve been following these flowcharts here on E&E for several years now.
Here's a chart from the EIA which may interest you:

Make your own chart:
https://www.eia.gov/electricity/data/browser/#/topic/0?agg=1,0,2&fuel=02&geo=vvvvvvvvvvvvo&sec=o3g&linechart=ELEC.GEN.AOR-US-99.A~ELEC.GEN.AOR-US-1.A~ELEC.GEN.AOR-US-94.A~ELEC.GEN.AOR-US-96.A~ELEC.GEN.AOR-US-97.A&columnchart=ELEC.GEN.AOR-US-99.A~ELEC.GEN.AOR-US-1.A~ELEC.GEN.AOR-US-94.A~ELEC.GEN.AOR-US-96.A~ELEC.GEN.AOR-US-97.A&map=ELEC.GEN.AOR-US-99.A&freq=A&start=2001&end=2018&chartindexed=0&ctype=linechart<ype=pin&rtype=s&pin=&rse=0&maptype=0
OKIsItJustMe
(19,938 posts)U.S. renewable electricity generation has doubled since 2008
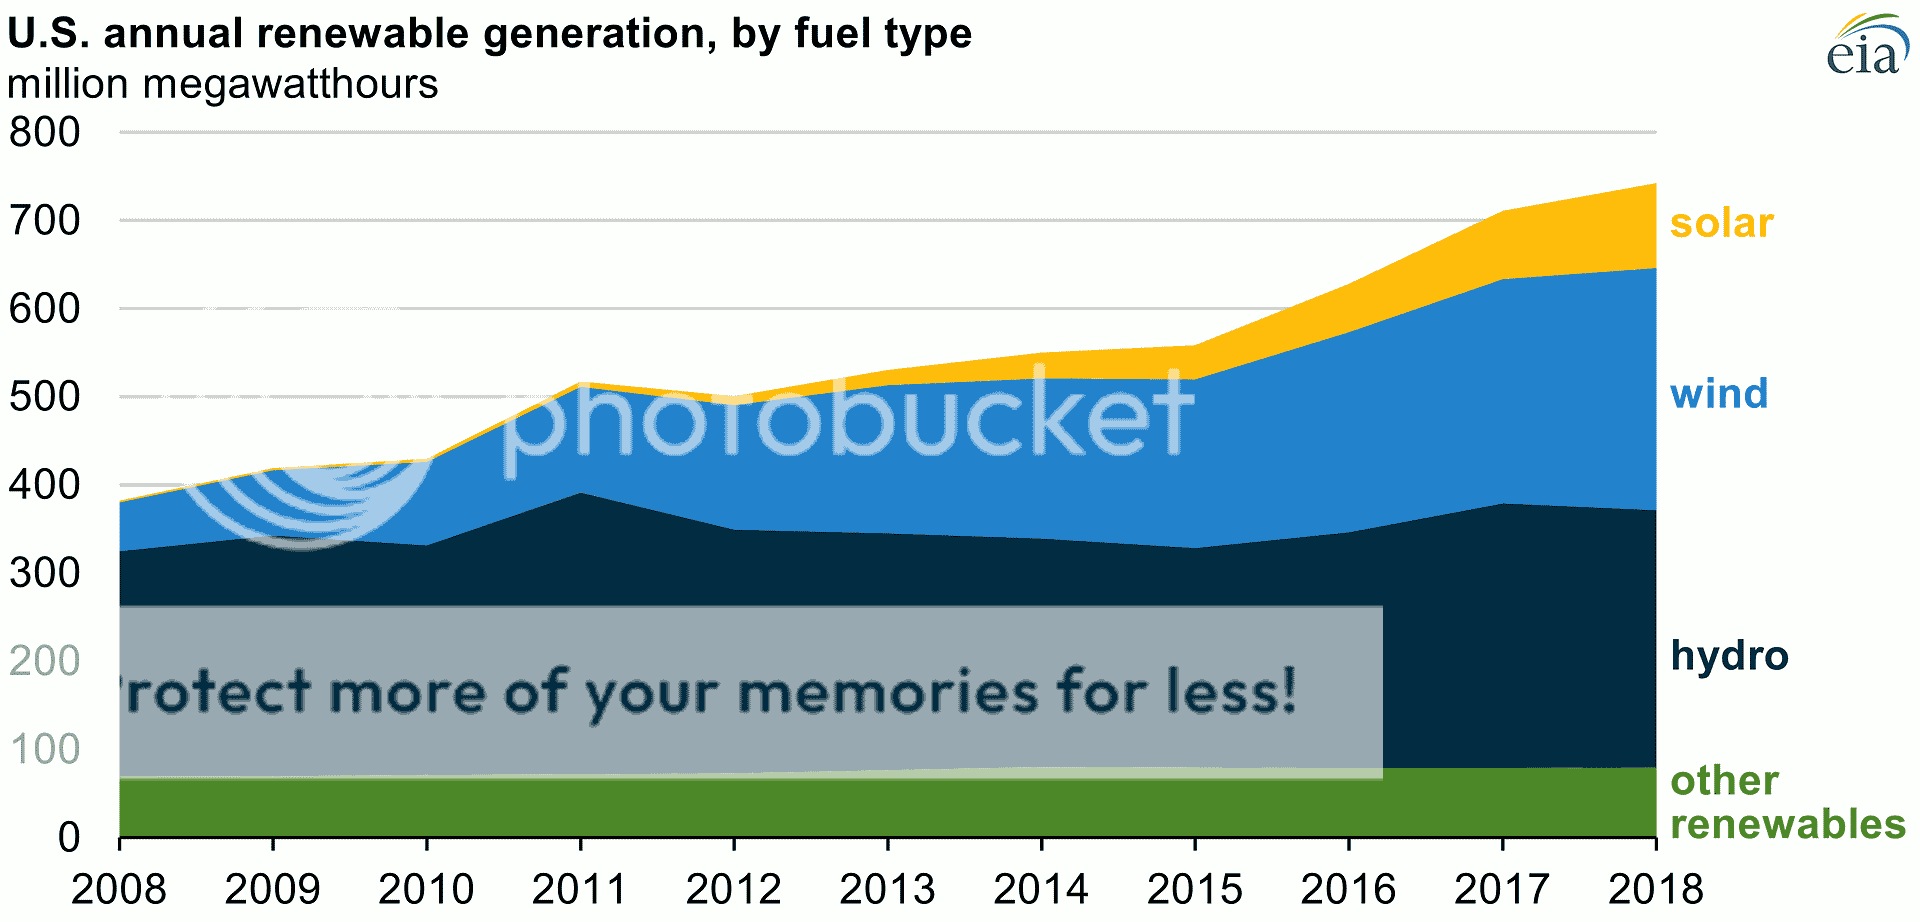
Source: U.S. Energy Information Administration, Electric Power Monthly
Renewable generation provided a new record of 742 million megawatthours (MWh) of electricity in 2018, nearly double the 382 million MWh produced in 2008. Renewables provided 17.6% of electricity generation in the United States in 2018.
Nearly 90% of the increase in U.S. renewable electricity between 2008 and 2018 came from wind and solar generation. Wind generation rose from 55 million MWh in 2008 to 275 million MWh in 2018 (6.5% of total electricity generation), exceeded only by conventional hydroelectric at 292 million MWh (6.9% of total generation).
U.S. solar generation has increased from 2 million MWh in 2008 to 96 million MWh in 2018. Solar generation accounted for 2.3% of electricity generation in 2018. Solar generation is generally categorized as small-scale (customer-sited or rooftop) solar installations or utility-scale installations. In 2018, 69% of solar generation, or 67 million MWh, was utility-scale solar.
…
progree
(10,904 posts)Last edited Mon Apr 15, 2019, 01:48 PM - Edit history (1)
in the Other Renewables category, annual, U.S.
In post#11 it is about 40 million MWH
In post#9 it is about 410,000,000 MWH = 400 million MWH
Maybe I am in deep cognitive decline?
EDITED after post#16:
In post#9, other renewables is about 410,000 thousand MWH = 410,000,000 MWH = 410 million MWH
In post#11 the green band "other renewables" part of the graph is about 40 million MWH
Maybe I am in deep cognitive decline?
OKIsItJustMe
(19,938 posts)Post #9, measuring "Other Renewables" (i.e. other than hydro) is in thousands of megawatthours
Post #11, measuring "renewable electricity" is in millions of megawatthours
Compare post #11 (subtracting the hydro) to post #9.
progree
(10,904 posts)In post#9, (also the top graph of your #16) other renewables is about 410,000 thousand MWH = 410,000,000 MWH = 410 million MWH
In post#11 (also the bottom graph of your #16) the green band "other renewables" part of the graph is about 40 million MWH
OKIsItJustMe
(19,938 posts)Notice how in Post #11, “Other” shows very little increase (i.e. it is a “green band”) while in Post #9 “Other” shows a dramatic increase over time.
In Post #9, I believe “Other” means “Other than hydro”
In Post #11, I believe “Other” means “Other than hydro, solar & wind.” (e.g. “biomass”)
progree
(10,904 posts)Thanks!
OKIsItJustMe
(19,938 posts)progree
(10,904 posts)mitch96
(13,895 posts)Waste?
m

caraher
(6,278 posts)"Waste" in the sense of energy that cannot be used for the intended purpose mainly due to basic physics. Heat engine losses due to the Second Law of Thermodynamics, losses in electrical transmission, etc.
mitch96
(13,895 posts)on a large scale. If you don't use it you lose it kinda thing...
m
progree
(10,904 posts)frequency increases or slows down. If the problem is generation < load, the system frequency slows down, and the governors on the online generators automatically raise generation, which pushes the frequency back up.
(And the opposite in the case of generation > load -- system frequency speeds up and the governors back down the generators.)
Back to the first case of generation < load -- If these actions are insufficient, i.e. all generators on the system have had their generation raised to maximum, and yet the frequency continues to drop and dips below a certain point, than automatic load-shedding occurs. If that still doesn't do the job and the frequency dips below a certain level, the generators trip to protect themselves from damage and a big chunk of the regional power system probably goes down.
The opposite -- generation in excess of the load -- works the same way except everything in the opposite direction.
As for all the talk of storing energy and using it at a better time -- yup, but still, the total generation (including storage device outputs) must still meet the total system load (including storage device usage for recharging).
The huge energy losses in the energy flow diagrams are what caraher said.
Thermal power plants (nuclear and fossil fuel) are only about 30 to 60% efficient (the 60% figure is about the maximum obtained by combined cycle). Other than combined cycle, the range is more like 30 to 40% efficient. That's because converting heat to mechanical motion (to turn the turbine which is attached to the generator), as all thermal power plants do, is an inherently inefficient process that is limited by the temperature difference between hottest and coldest temperatures available to it.
https://en.wikipedia.org/wiki/Heat_engine
I worked as an electrical engineer in the planning and system operations departments of an electrical utility (Northern States Power Co, now part of Xcel) for about 15 years, in the late 1970s - 1992. This was before wind and solar were a factor.
As for excess wind generation -- when all of the power system's online generators are backed down to their minimum operating points and still the total system generation is on course to exceed the load -- the wind turbines can be and are shut down if the economics are favorable to that (shutting down and restarting a thermal power plant incurs energy and additional maintenance costs, so it will often be cheaper to shut down the wind turbines than to shut down a thermal power plant that has to be brought back on line in a few or several hours, or in some cases an entire weekend).
I presume the wind turbines also shut down automatically in case of excessive system frequency. I know they do if the wind speed is too great.
I don't think that shutting down wind or solar is represented as a loss in the energy flow diagram. It's just electricity that could be generated but wasn't.
The other losses are at the customer end (the right side of the diagram), e.g. a typical home furnace efficiency is 75%. The other 25% goes up the chimney. (New furnaces must by law be at least 78% efficient, Google sez).
Well, as the fine print wording below the diagram says:
mitch96
(13,895 posts)Are you talking 60 hz or how often it's used?
m
progree
(10,904 posts)Last edited Mon Apr 15, 2019, 02:03 PM - Edit history (1)
in, for example, the Eastern Interconnection (2/3 of the U.S.), the electric power grid is one humongous monster electrical-mechanical "machine" operating as one entity in synchronism where every moment, generation matches load (+ transmission and distribution line losses) almost exactly every second and minute. If not -- adjustments are automatically made to quickly restore the balance. If those adjustments aren't enough, soon enough, and the dispatchers can't do something pretty quickly, a lot of shit happens big time.
So there is no wasted electricity (other than the line losses) in the grid. That's not coming from some chest-thumping utility guy bragging, it's just the physics of the situation.
Yes, there's a ton of wasted energy in making the electricity (converting the energy content in nuclear and fossil fuels into electricity), and of course a ton wasted by customer devices. But not in the grid itself (again other than line losses)
The Eastern Interconnection is the entire eastern 2/3 of the U.S. (ends at the Rocky Mountains), EXcluding the Texas Interconnection, which is its own monster synchronous machine.
https://en.wikipedia.org/wiki/Eastern_Interconnection
Many decades ago, I once worked for a place that generated a ton of electrical power (I'll just say greater than 100 MW) and energy. But the local utility couldn't use it because our generation was intermittent and unpredictable, and anyway some heavy duty transmission would have to have been built out to this unimaginably remote location.
So what happened to all that electricity that nobody wanted?
It went to a huge huge resistor in a big water-filled cooling tank. The hot water produced went to a cooling tower that emitted a monster cloud of water vapor that could be seen tens of miles away.
But I've never heard of an electric utility that has something like that! I don't think wind farms or solar farms do anything like this either.