RealClimate - 2022 Updates To The Temperature Records
EDIT
It’s well known (among readers here, I assume), that ENSO influences the interannual variability of the climate system and the annual mean temperatures. El Niño events enhance global warming (as in 1998, 2010, 2016 etc.) and La Niña events (2011, 2018, 2021, 2022 etc.) impart a slight cooling.
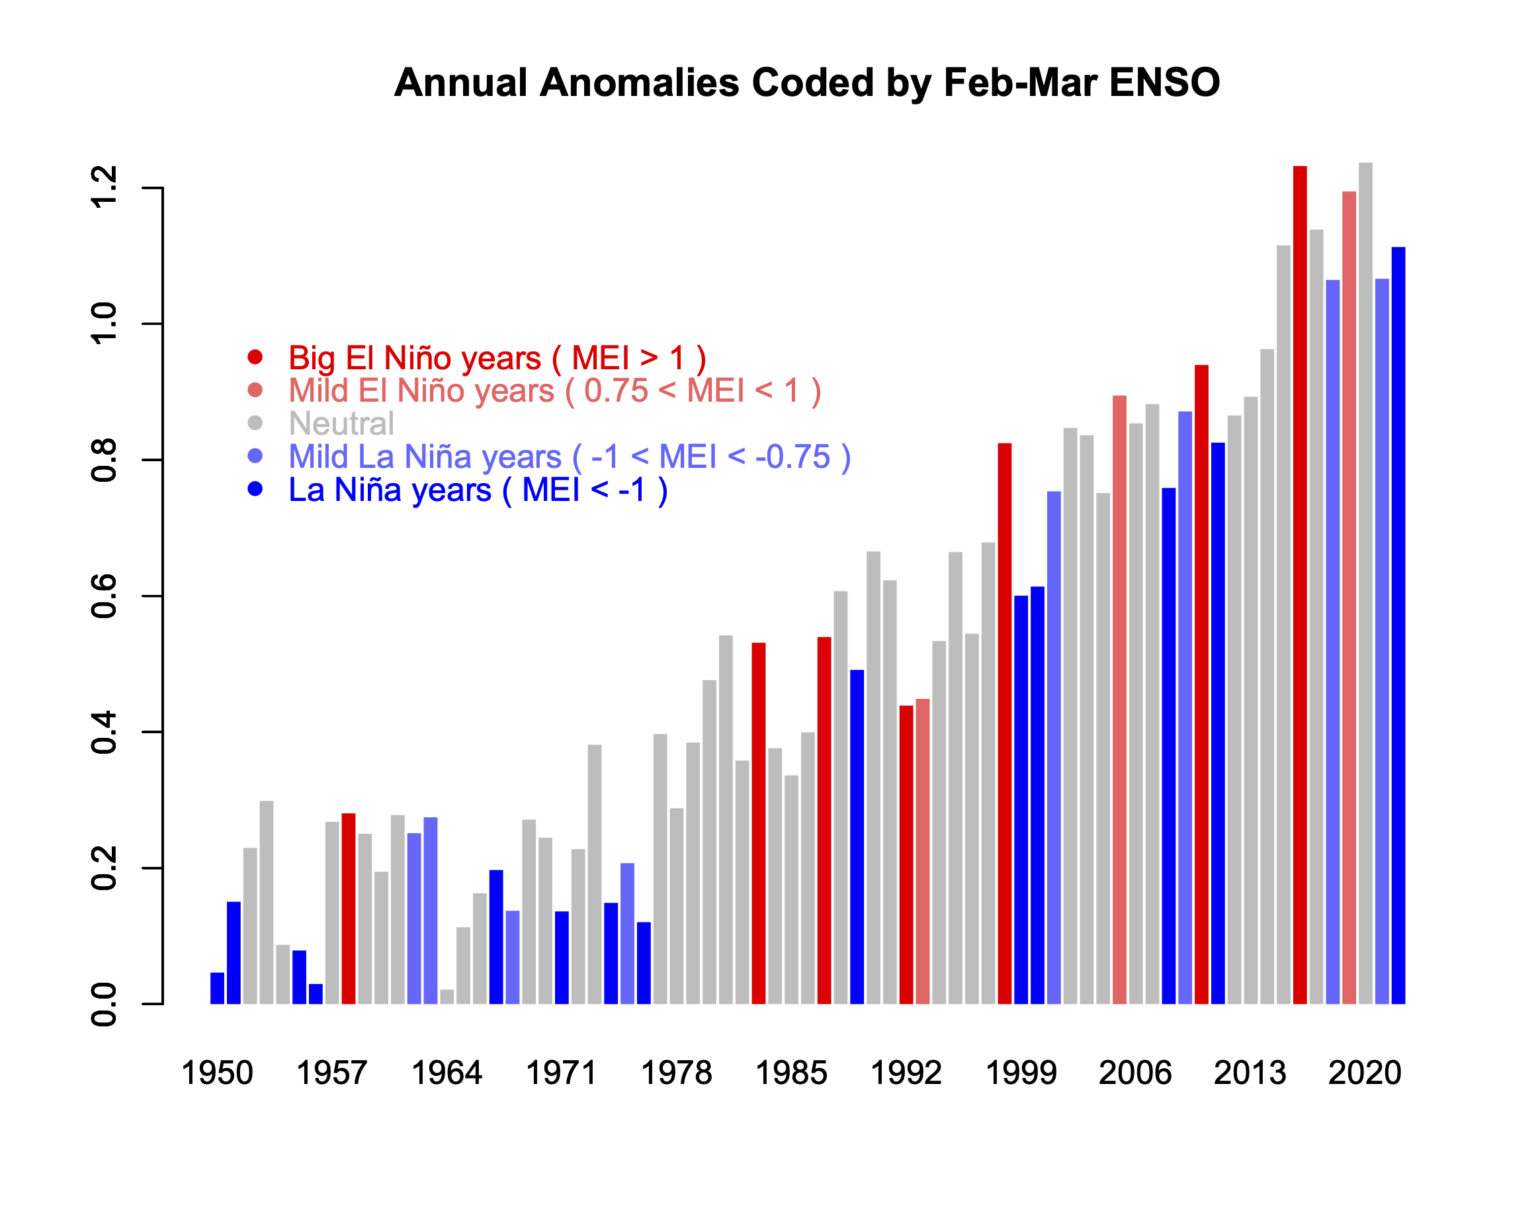
GISTEMP anomalies (w.r.t. late 19th C) coded for ENSO state in the early spring.
Consequently, a line drawn from an El Niño year to a subsequent La Niña year will almost always show a cooling – a fact well known to the climate disinformers (though they are not so quick to show the uncertainties in such cherry picks!). For instance, the trends from 2016 to 2022 are -0.12±0.37ºC/dec but with such large uncertainties, the calculation is meaningless. Far more predictive are the long term trends which are consistently (now) above 0.2ºC/dec (and with much smaller uncertainties ±0.02ºC/dec for the last 40 years).
It’s worth exploring quantitatively what the impact is, and this is something I’ve been looking at for a while. It’s easy enough correlate the detrended annual anomalies with the ENSO index (maximum correlation is for the early spring values), and then use that regression to estimate the specific impact for any year, and to estimate an ENSO-corrected time series.
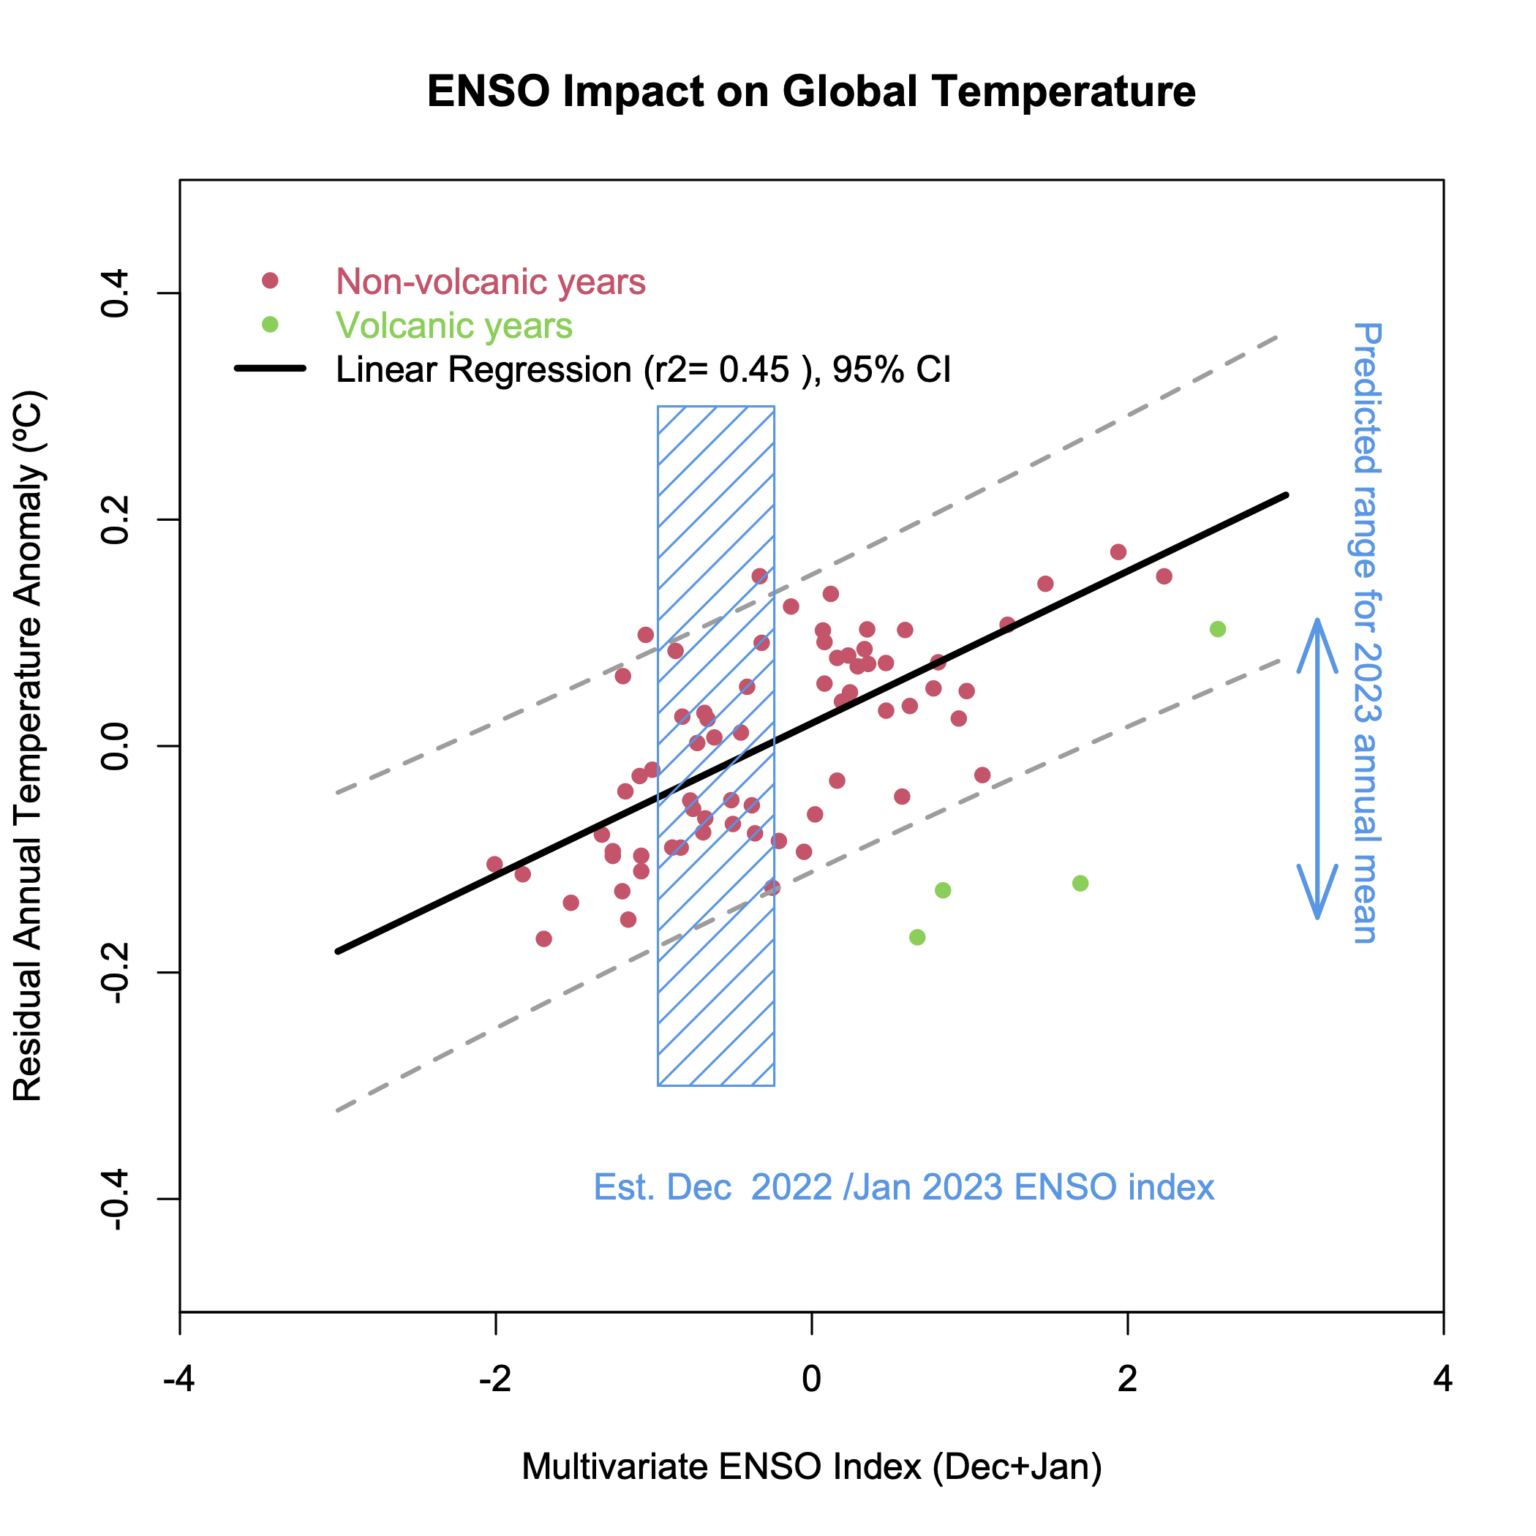
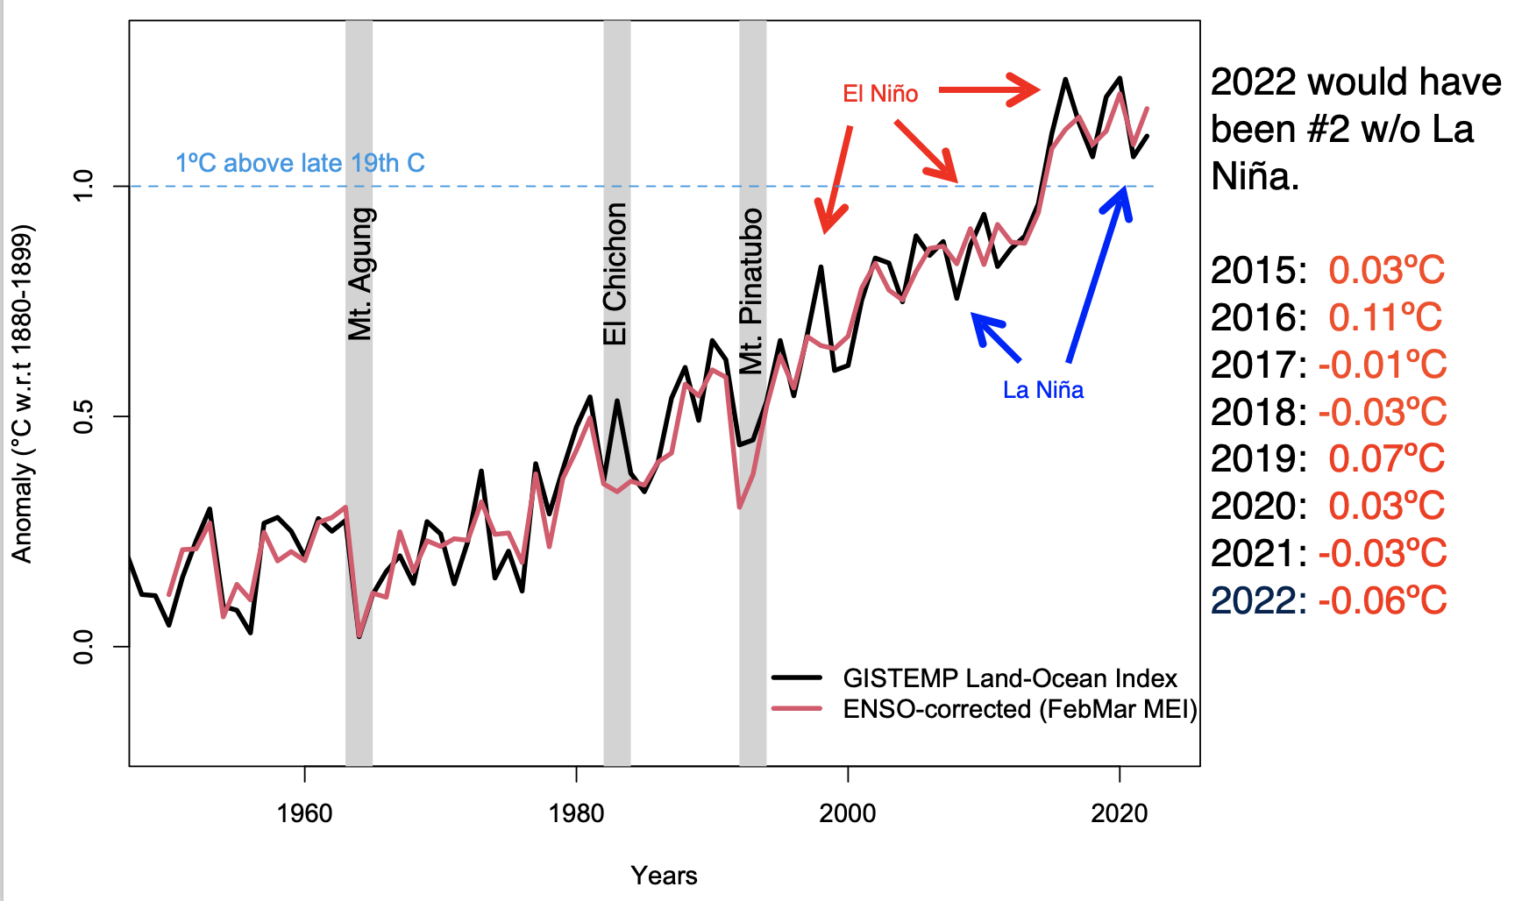
a) Correlation between an ENSO index (in Feb/Mar) and the detrended annual anomaly. b) An ENSO-corrected version of the GISTEMP record.
Back in 2013/2014, the differences between the surface indices (HadCRUT3, NOAA v3 and GISTEMP v3) contributed to the initial confusion related to the ‘pause’, which was seemingly evident in HadCRUT3, but not so much in the other records (see this discussion from 2015). Since then all of the series have adopted improved SST homogenization, and HadCRUT5 adopted a similar interpolation across the pole as was used in the GISTEMP products. From next month onwards, NOAA will move to v5.1 which will now incorporate Arctic buoy data (a great innovation) and also provide a spatially complete record. The consequence is that the surface instrument records will be far more coherent than they have ever been. Some differences remain pre-WW2 (lots of SST inhomogeneities to deal with) and in the 19th C (where data sparsity is a real challenge).
EDIT
https://www.realclimate.org/index.php/archives/2023/01/2022-updates-to-the-temperature-records/