Environment & Energy
Related: About this forumThe Greenland Melt - Eric Steig At Real Climate On Finally Finding Key Eemian Ice Data
EDIT
The big news is that this group has managed to obtain and use the information in ice from the Eemian — the peak of the last interglacial period, about 125,000 years ago — in Greenland. Getting usable Eemian ice from Greenland has been a Holy Grail of ice core research for the better part of two decades. We thought, back in the early 1990s, that we had obtained Eemian ice in the GISP2 and GRIP ice cores drilled near the ice sheet summit. It turned out that the lowermost part — anything older than 100,000 years — was messed up by ice flow, making it impossible to learn anything much about climate from it. The Danish group then led a project further to the north at “North GRIP” that, based on radar-echo-sounding data, should have had an intact Eemian period. But the temperature at the base at NGRIP was higher than expected, and the Eemian ice had melted away. The latest attempt was the “North Eemian” (NEEM) site in northeast Greenland. Here too, the initial results were disappointing. As at GISP2 and GRIP, there are folds in the ice, and some of the layers containing the ice of Eemian age are repeated several times. However, in this case the folds are very large, and there are continuous sections that are not scrambled; they are just a bit out of order. It took significant work, but the group has unfolded the data from the folded layers and it is now evident that the goal of the NEEM project– having an interpretable section of Eemian ice — has succeeded after all.
The findings are spectacular. In the Eemian ice, there is clear evidence of significant melting of what would then have been snow at the surface. The amount of air trapped in the ice undergoes rapid fluctuations, resulting from the fact that ice that melts and then refreezes generally winds up with fewer air bubbles in it than the original porous snow. There are also strong fluctuations observed in soluble gases such as N2O whereas variations in the oxygen isotope concentration — both in the molecular oxygen (O2) in the air and in the ice (H2O) itself — are small. The isotope concentration of the O2 can be matched to that in undisturbed ice from the same time period in ice cores from Antarctica, providing a way to date the ice, showing unambiguously that non-disturbed layers are preserved from the peak of the Eemian period, about 125,000 years ago.
Qualitatively, the evidence for melt in the NEEM Eemian ice shows that it was warm at the time. Obviously. But more interestingly, the last year of the NEEM project was 2012, and researchers were able to witness first hand what the formation of melt layers mean at NEEM in terms of the ambient conditions. In July 2012, the NEEM saw above-freezing temperatures for six consecutive days (10 to 15 July), with rain events on 11 and 13 July. When the water refroze, it formed several distinct, clear layers of ice (which we call a “melt layers”) between 5 and about 60 cm down in the snow, about 1 cm thick. This is a rare event. It was so warm over Greenland in that week that a significant melt layer also formed up at the Summit; in fact, the entire surface of the ice sheet was melting. That hasn’t happened — not once — in the entire satellite record (see Jason Box’s excellent blog, meltfactor.org for more on this, and Marco Tedesco's paper.). In fact, examination of melt layer records from ice cores at Summit shows that a melt layer like the one that formed in 2012 was the most significant Greenland melt event since at least the late 19th century. If you drill about 100 m down into the ice and recover an ice core, you invariably find that layer, shown in the photo below (the bright line at which the person’s thumb is pointing).
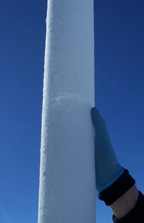
Greenland ice core from ~80 m depth. E. Steig photo.
EDIT
None of this should be interpreted to suggest that we are in “Eemian-like” conditions just yet. After all, there has only been one Eemian-like melt event observed in modern times, and the extremely warm summer of 2012 clearly involved anomalous weather conditions — a particular pattern of pressure anomalies over the northern high latitudes (e.g. Tedesco et al. (2012)) that may also partly account for the exceptional low sea ice cover that year. The 2012 event, however, gives us a flavor of what the future is likely to bring. It will be very interesting to watch the satellite imagery over Greenland in the next decade and beyond.
What are the implications for the Greenland ice sheet? Possibly, that it is less sensitive to climate warming than some of the higher-end estimates suggest (e.g. Cuffey and Marshall (2000) suggested Greenland could have contributed > ~4 m to EEM sea level), though very much in line with more recent estimates (e.g. Pfeffer et al. (2008)). The estimated temperature change of ~8°C is quite a bit warmer than most previous estimates which are more in the range of 2-5°C (though the uncertainty estimates clearly overlap). Thus, whatever the contribution of mass loss from the Greenland ice sheet to the huge (4-8 m) rise in sea level of the Eemian, it occurred under very strong temperature forcing.
http://www.realclimate.org/index.php/archives/2013/01/the-greenland-melt/#more-14300
 = new reply since forum marked as read
Highlight:
NoneDon't highlight anything
5 newestHighlight 5 most recent replies
= new reply since forum marked as read
Highlight:
NoneDon't highlight anything
5 newestHighlight 5 most recent replies
