Environment & Energy
Related: About this forumA Terrifying Jump in Global Temperatures
A monster El Nino firing off in the Pacific. A massive fossil fuel driven accumulation of greenhouse gasses in the atmosphere pushing CO2 levels well above 400 parts per million. The contribution of other greenhouse gasses pushing the total global heat forcing into the range of 485 parts per million CO2e. Given this stark context, we knew the numbers were probably going to be bad. We just didn’t know how bad. And, looking at the initial measures coming in, we can definitely say that this is serious.
According to today’s report from Japan’s Meteorological Agency, global temperatures jumped by a ridiculous 0.36 degrees Celsius from the period of December 2014 — the previous hottest December in the global climate record — through December 2015 — the new hottest December by one heck of a long shot. To put such an amazing year-on-year monthly jump in global temperatures into context, the average decadal rate of global temperature increase has been in the range of 0.15 C every ten years for the past three and a half decades. It’s as if you lumped 20 years of human forced warming all into one 12 month differential.

Better get hopping with those windmills...
 = new reply since forum marked as read
Highlight:
NoneDon't highlight anything
5 newestHighlight 5 most recent replies
= new reply since forum marked as read
Highlight:
NoneDon't highlight anything
5 newestHighlight 5 most recent replies

lapfog_1
(29,199 posts)positive feedback loop engaged, permafrost melting... hydrates on the sea floor are next
I think the models have been too conservative and that the tipping point was reached some time ago
GliderGuider
(21,088 posts)Can I have my blue pill now? That red one gave me a heartache.
lapfog_1
(29,199 posts)for NASA in the 1990s... specifically the MTPE DAO (Data Acquisition Office).
That was the time to stop burning all fossil fuels... and plant a lot of forests.

SusanCalvin
(6,592 posts)Hope I die before I get old. Oh wait..... ;->

Gregorian
(23,867 posts)You'll soon forget all of your cares.
I was on a walk today, and thinking about why I never hear anyone talking about what the world might be like in 1000 years, not just 50. Where's that beer?
Duppers
(28,117 posts)Ignorance is disgusting.
muriel_volestrangler
(101,295 posts)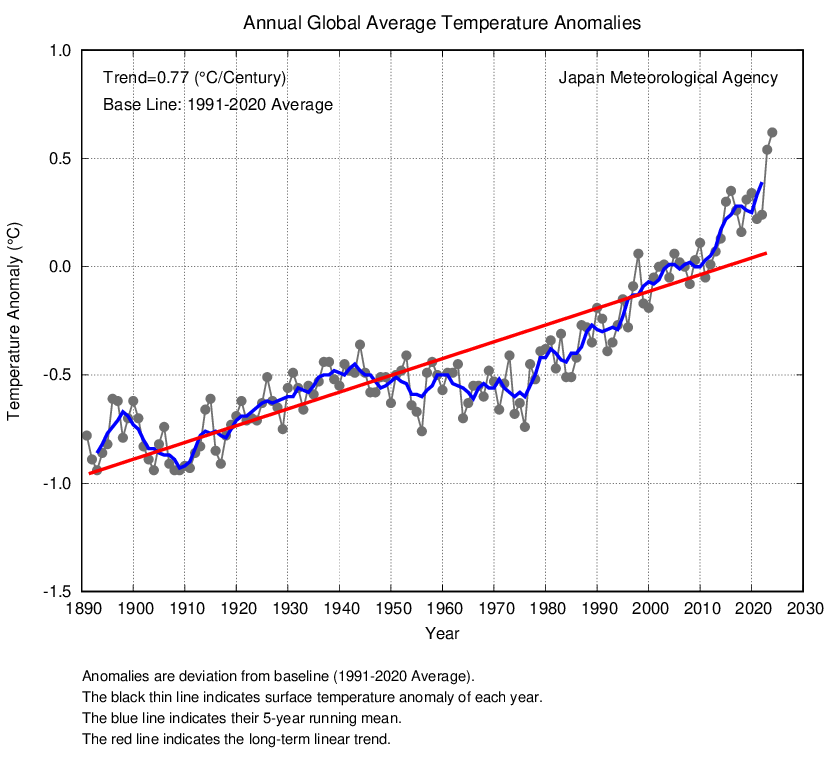

LouisvilleDem
(303 posts)Displaying December only requires an explanation, and none is given.
tk2kewl
(18,133 posts)
GliderGuider
(21,088 posts)Ghost Dog
(16,881 posts)Now financial system "rewiring"...
GliderGuider
(21,088 posts)At Middle East wellheads and on Chinese factory floors.
Round and round and round she goes,
And where she stops, nobody knows...

hunter
(38,309 posts)What can I say? My parents were prolific.
My siblings and I all held at 1,2, or 3, average "replacement" I guess.
Time to teach the kids how to migrate gracefully maybe, same way their ancestors left Europe.
Don't be where the famines and wars are.
But this time it's the entire earth going down the tubes, all at once.
Where to go?
No fun.
LouisvilleDem
(303 posts)Why show temperature averages for the month of December only? I smell cherry picking...
GliderGuider
(21,088 posts)Nothing nefarious.
NickB79
(19,233 posts)The JMA cherry picking? No.
LouisvilleDem grasping at straws? Yes.
LouisvilleDem
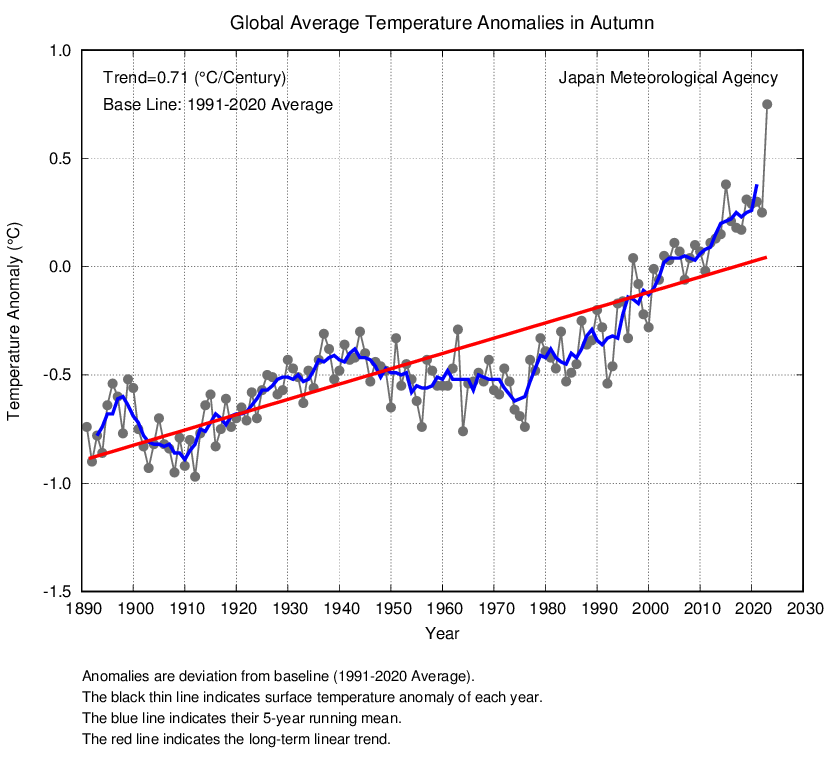
(303 posts)I like the annual graph better if for no other reason than it offers broader context and less noise.
Still, 0.71°C per century isn't exactly a rate of warming to write home about, is it?
NickB79
(19,233 posts)It's a faster rate of warming than the planet has seen for millions of years.
http://earthobservatory.nasa.gov/Features/GlobalWarming/page3.php
And might I add, this level of warming is against a strong climactic headwind as the planet was supposed to be entering a new Ice Age: http://www.cnn.com/2016/01/14/world/ice-age-postponed/index.html
"As far as the human power is concerned, the main lesson is that by burning fossil fuel over just one century we will affect climate for at least 100,000 years or even more," lead researcher Andrey Ganopolski tells CNN.
It's like an Olympic sprinter breaking a world record by a crazy amount of time, while simultaneously pulling a chain of bowling balls behind him.
And even though we're already warming 10X faster than the end of the last ice age, the recent spike visible in the annual graph in post #7 shows that we may be seeing the long-feared acceleration phase many climate scientists have predicted as multiple positive feedback loops are engaged.
LouisvilleDem
(303 posts)Some believe rapid change has happened in the past:
http://science.sciencemag.org/content/321/5889/680.short
The last two abrupt warmings at the onset of our present warm interglacial period, interrupted by the Younger Dryas cooling event, were investigated at high temporal resolution from the North Greenland Ice Core Project ice core. The deuterium excess, a proxy of Greenland precipitation moisture source, switched mode within 1 to 3 years over these transitions and initiated a more gradual change (over 50 years) of the Greenland air temperature, as recorded by stable water isotopes. The onsets of both abrupt Greenland warmings were slightly preceded by decreasing Greenland dust deposition, reflecting the wetting of Asian deserts. A northern shift of the Intertropical Convergence Zone could be the trigger of these abrupt shifts of Northern Hemisphere atmospheric circulation, resulting in changes of 2 to 4 kelvin in Greenland moisture source temperature from one year to the next.
http://www.sciencedaily.com/releases/2008/06/080619142112.htm
The ice core showed the Northern Hemisphere briefly emerged from the last ice age some 14,700 years ago with a 22-degree-Fahrenheit spike in just 50 years, then plunged back into icy conditions before abruptly warming again about 11,700 years ago. Startlingly, the Greenland ice core evidence showed that a massive "reorganization" of atmospheric circulation in the Northern Hemisphere coincided with each temperature spurt, with each reorganization taking just one or two years, said the study authors.
truebrit71
(20,805 posts)Heads up folks, we got a live one....
LouisvilleDem
(303 posts)...and take the time to read my post to see what I am actually referring to.
hatrack
(59,583 posts)
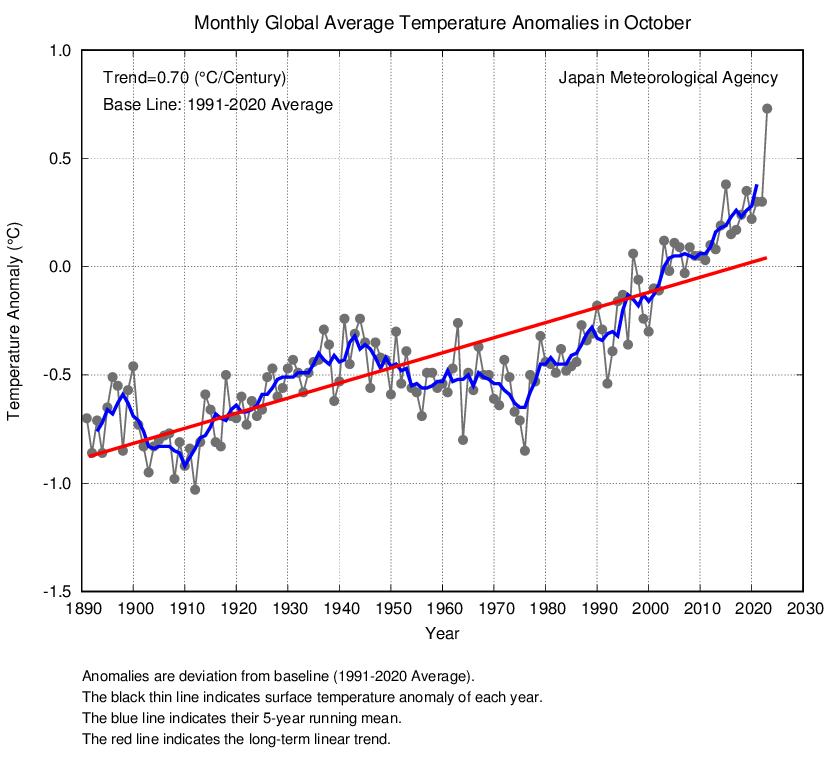
Here's October:
Here's September:

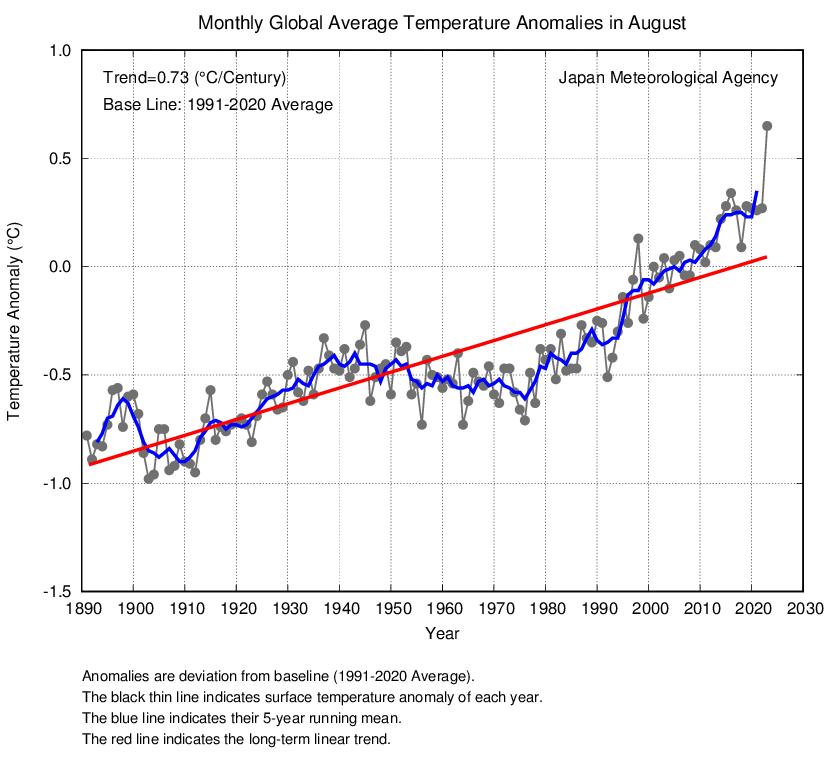
Here's August:
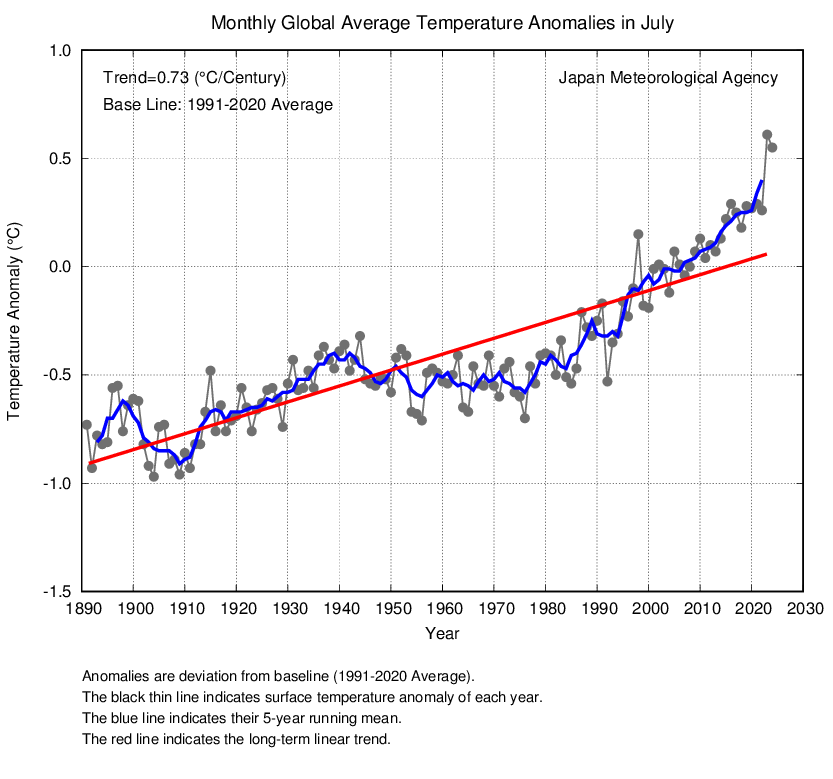
Here's July:
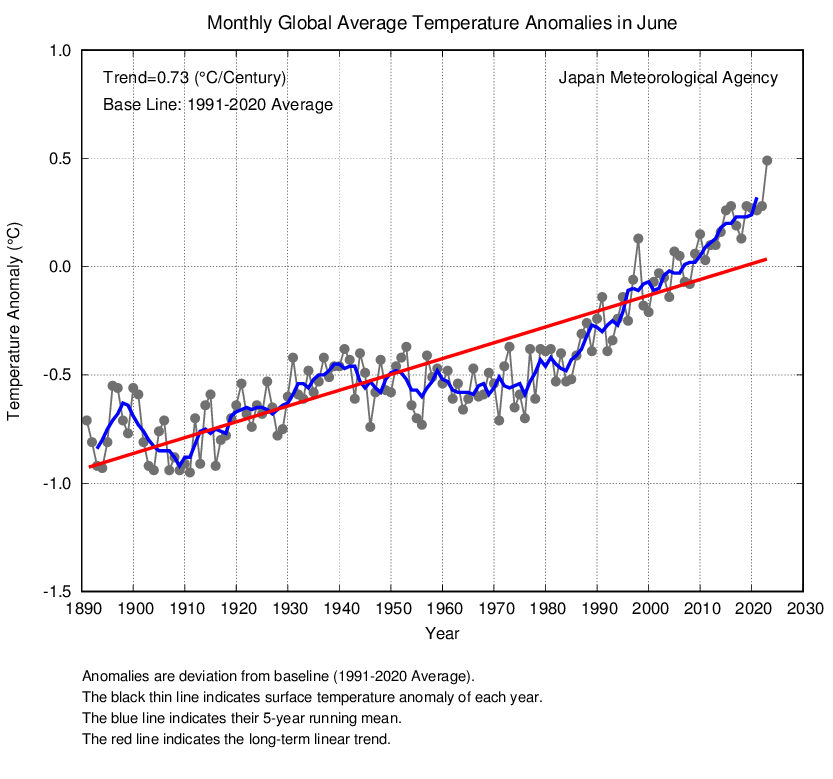
Here's June:
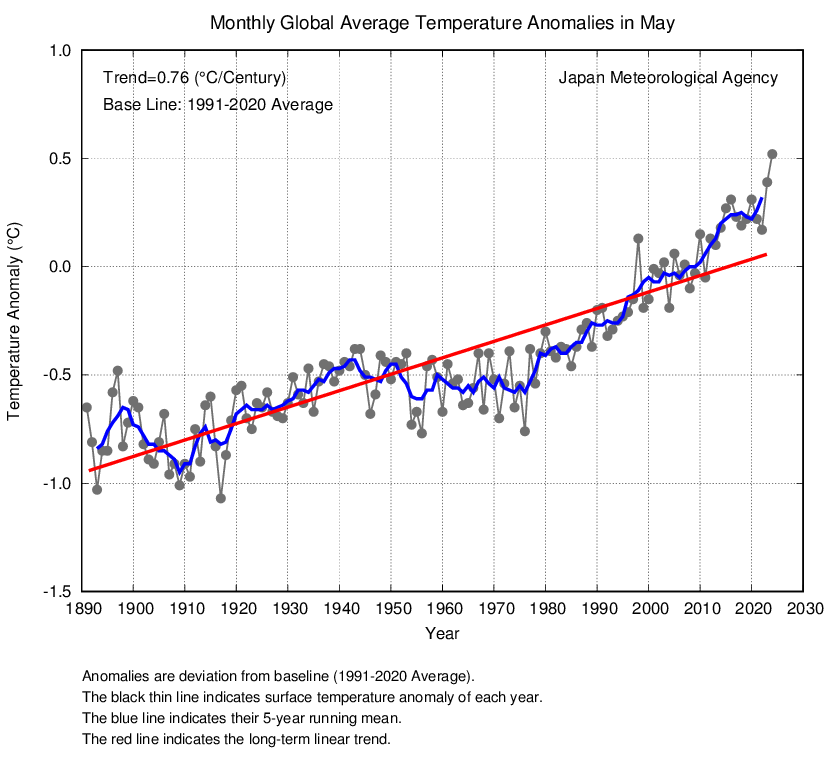
Here's May:
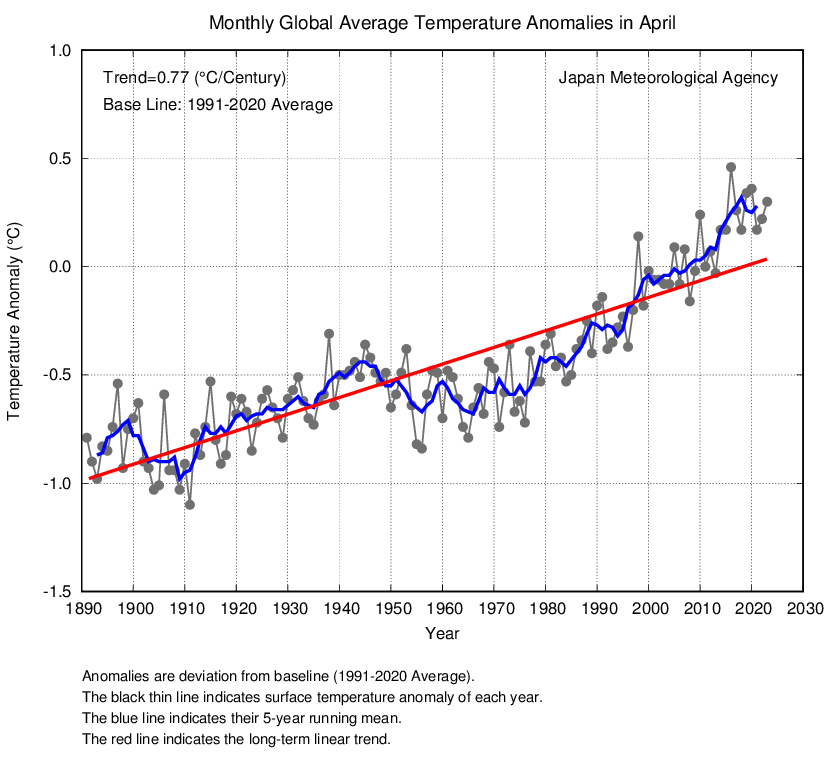
Here's April:
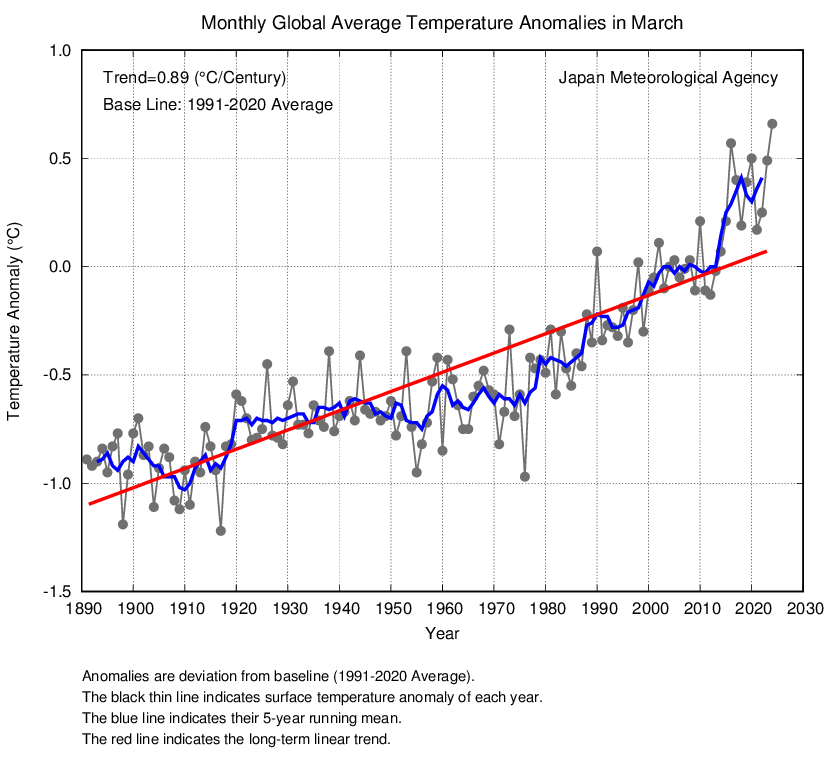
Here's March:
Here's February:

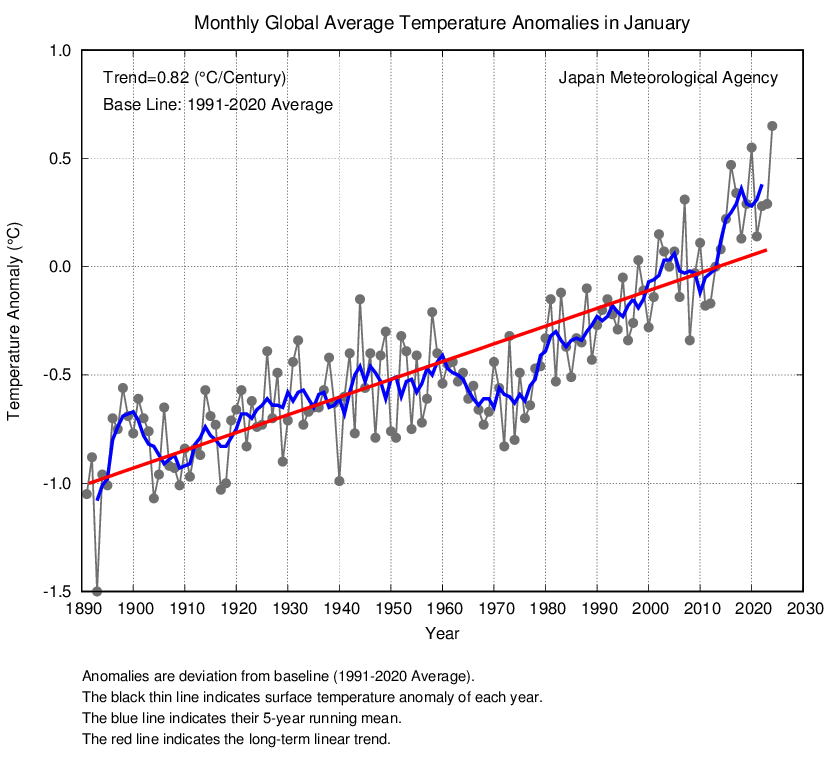
Here's January:
Here's Fall:
Here's Summer:

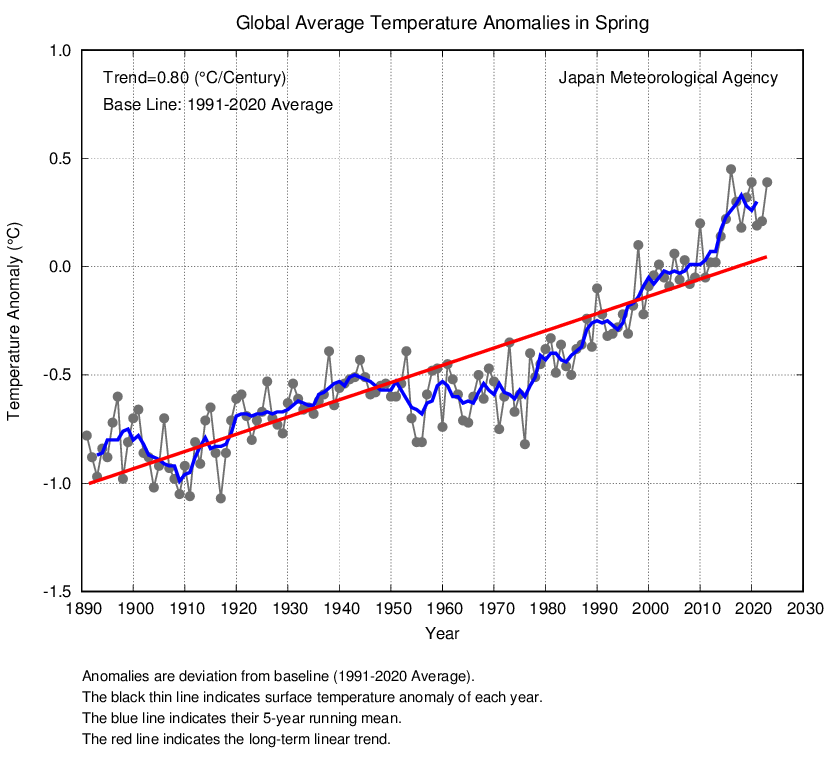
Here's Spring:
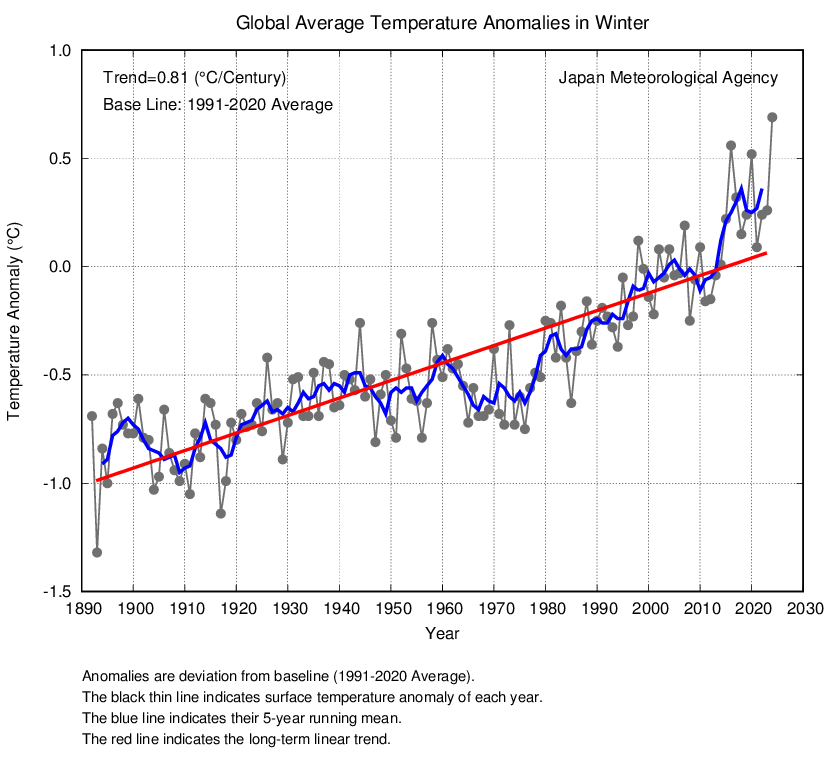
Here's Winter:
http://ds.data.jma.go.jp/tcc/tcc/products/gwp/temp/win_wld.html
Anything else I can get for you?
LouisvilleDem
(303 posts)It's amazing the difference between the months. For example, the trend varies considerably, from a low of 0.63°C to a high of 0.83°C. Heck, if you were to only look at the Jan-Mar months you can make it look like there was not only a 'pause', but that temperatures were actually declining from 2000-2015 (which of course is not true).
This shows how important it is to stick to displaying annual averages rather than a specific months.