Environment & Energy
Related: About this forumDecoupling of global emissions and economic growth confirmed
https://www.iea.org/newsroomandevents/pressreleases/2016/march/decoupling-of-global-emissions-and-economic-growth-confirmed.html[font size=4]IEA analysis shows energy-related emissions of CO₂ stalled for the second year in a row as renewable energy surged[/font]
16 March 2016 Paris
[font size=3]Global energy-related carbon dioxide emissions (CO₂ ) – the largest source of man-made greenhouse gas emissions – stayed flat for the second year in a row, according to analysis of preliminary data for 2015 released today by the International Energy Agency (IEA).
“The new figures confirm last year’s surprising but welcome news: we now have seen two straight years of greenhouse gas emissions decoupling from economic growth,” said IEA Executive Director Fatih Birol. “Coming just a few months after the landmark COP21 agreement in Paris, this is yet another boost to the global fight against climate change.”

Global emissions of carbon dioxide stood at 32.1 billion tonnes in 2015, having remained essentially flat since 2013. The IEA preliminary data suggest that electricity generated by renewables played a critical role, having accounted for around 90% of new electricity generation in 2015; wind alone produced more than half of new electricity generation. In parallel, the global economy continued to grow by more than 3%, offering further evidence that the link between economic growth and emissions growth is weakening.
In the more than 40 years in which the IEA has been providing information on CO₂ emissions, there have been only four periods in which emissions stood still or fell compared to the previous year. Three of those – the early 1980s, 1992 and 2009 – were associated with global economic weakness. But the recent stall in emissions comes amid economic expansion: according to the International Monetary Fund, global GDP grew by 3.4% in 2014 and 3.1% in 2015.
…[/font][/font]
 = new reply since forum marked as read
Highlight:
NoneDon't highlight anything
5 newestHighlight 5 most recent replies
= new reply since forum marked as read
Highlight:
NoneDon't highlight anything
5 newestHighlight 5 most recent replies

pscot
(21,024 posts)have increased almost 40% in the past 16 years compared to about a 25% increase between 1975 and 2000.
GliderGuider
(21,088 posts)
OKIsItJustMe
(19,937 posts)GliderGuider
(21,088 posts)From 3.5 to 9.8 GT/yr 
OKIsItJustMe
(19,937 posts)It is more of a “developing nations” problem; it’s just that:
- China’s industry is more “developed” than many other “developing” nations.
- China has a huge population.
GliderGuider
(21,088 posts)The problem gets identified with China because that's the country where the greatest CO2 increase happened over the last 16 years.
Plus India, Australia,Burma, Thailand, Malaysia...

hatrack
(59,578 posts)Oh well.
Annual atmospheric CO2 increase the biggest on record
Posted on March 16, 2016 by Bob Berwyn
 ?w=468&h=363
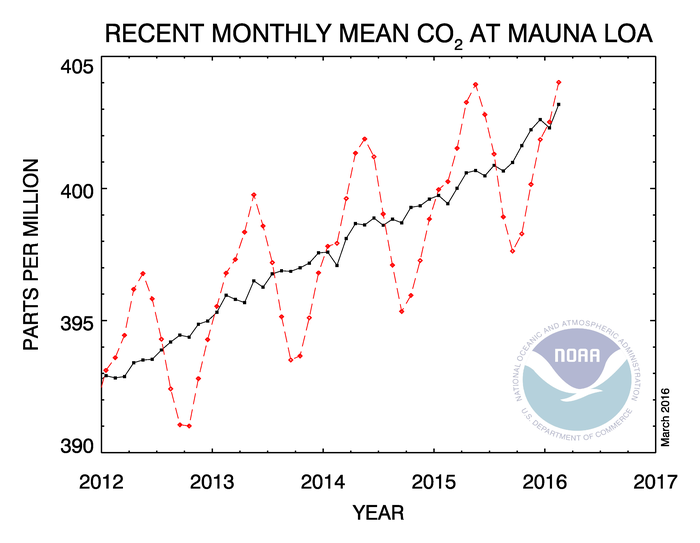
The goal of limiting atmospheric carbon dioxide to 350 parts per million — considered the environmentally “safe” level, just moved a little farther away. Scientists tracking concentrations of the heat-trapping pollutant at a mountaintop lab in Hawaii said last week that CO2 concentrations jumped by the largest annual amount recorded since measurements began 56 years ago.
The reading comes from NOAA’s Mauna Loa Observatory, and researchers said the latest increase was the fourth year in a row that CO2 concentrations grew by more than 2 parts per million, according to a press release from NOAA.
“Carbon dioxide levels are increasing faster than they have in hundreds of thousands of years,” said Pieter Tans, lead scientist of NOAA’s Global Greenhouse Gas Reference Network. “It’s explosive compared to natural processes.”
The most recent annual measurement showed that atmospheric carbon dioxide jumped by 3.05 parts per million during 2015. The thickening blanket of invisible gas generated mostly by burning fossil fuels has helped drive global surface temperatures to new records nearly every month during the past year. The current level of CO2 is higher than it has been in millions of years. That matters for many reasons, for example because scientists working in Antarctica said their research shows that, in ancient eras, there were massive meltdowns of ice sheets at similar CO2 levels — and sea level was many feet higher than today.
EDIT
http://summitcountyvoice.com/2016/03/16/72961/

NickB79
(19,224 posts)In fact, climbing faster now than ever before.
It's almost like we've lost what little control we may have had, and now the system is going where it wants to go regardless of what we do around the edges.
Emissions haven’t stopped, they are still as high as they have ever been. However, their rate is not increasing, even though there is financial growth, and that is a change.
Also, please note, the graph is not of all emissions, but “energy-related emissions.”
NickB79
(19,224 posts)Which I felt implied the fact that emissions have only stopped rising, not ceased altogether.
IMO, it appears positive-feedback loops, where the biosphere itself is now emitting massive amounts of carbon, are taking on a more significant role in warming now. Hence, our "lose of control" I mentioned.
OKIsItJustMe
(19,937 posts)The rate of emissions has not dropped, it is still at its highest level ever. So, I don’t see what is “funny” about the Mauna Loa graph continuing to climb.
We would only expect the Mauna Loa graph to be level if we were carbon neutral.
We would only expect it to drop if we had negative emissions.
Our emissions are at the highest rate they have ever been, so the Mauna Loa graph should be climbing at its highest rate.
GliderGuider
(21,088 posts)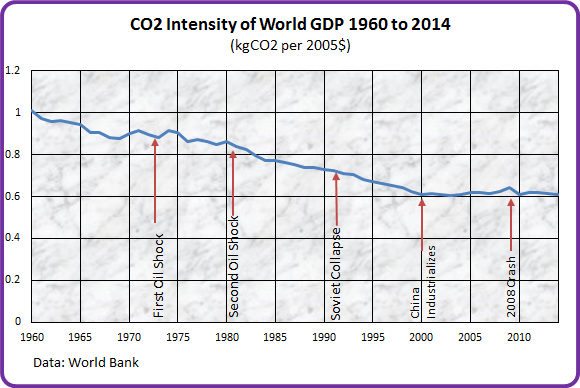
What I see in that graph is a gradual decarbonization of GDP up until 2000, at which time China's coal-fired industrialization locked the two indicators together. There has been no improvement in the carbon intensity of world aggregate GDP since then.
Even the gradual decarbonization from 1960 to 2000 isn't evidence of "decoupling" (which would amount to the world making money from rearranging money rather adding value by than making things.) It's more likely due to a combination of improving manufacturing efficiency, changes in the definition of GDP, and some shifts from manufacturing to service economies.
The decoupling that the IEA touts is a case of "a man hears what he wants to hear, and disregards the rest." That's either wishful thinking or flim-flam, depending on how generous you're feeling. Not to mention that a two-year period during an unacknowledged global recession is a very poor (even mendacious) baseline from which to draw conclusions about long-term economic behavior.
OKIsItJustMe
(19,937 posts)Honestly, we’re talking about a possible two-year long “trend.” How large a wiggle are you expecting to see in your graph? To draw the conclusions you do strikes me either as “either (doomer) thinking or flim-flam, depending on how generous you're feeling.”
GliderGuider
(21,088 posts)either in my data or theirs. As far as I can tell we were doing a much better job of decoupling GDP from emissions from 1980 to 2000.