2016 Postmortem
Related: About this forumPrivate Sector Job Growth Under President and Party 1961-2012
On May 8, Bloomberg News published an article by Bob Drummond about how more jobs have been created while Democrats were in the presidency from 1961-2012. This article, which was also discussed on dailybeast.com on May 10, not only references the recent growth in jobs, which have been less than expected, but also looks at the past. Clinton’s presidency is the main focus when Drummond examines the past. Bloomberg News created a graph like the second one below. However, we wanted to take the news outlet’s idea one step farther. Below you will see a bar chart where the number of private jobs created during each presidency is in sequential form, but separated by party. There is also a pie chart that shows the total number of private jobs created during Democrat and Republican presidencies from 1961-2012.
SOURCE
[IMG] [/IMG]
[IMG]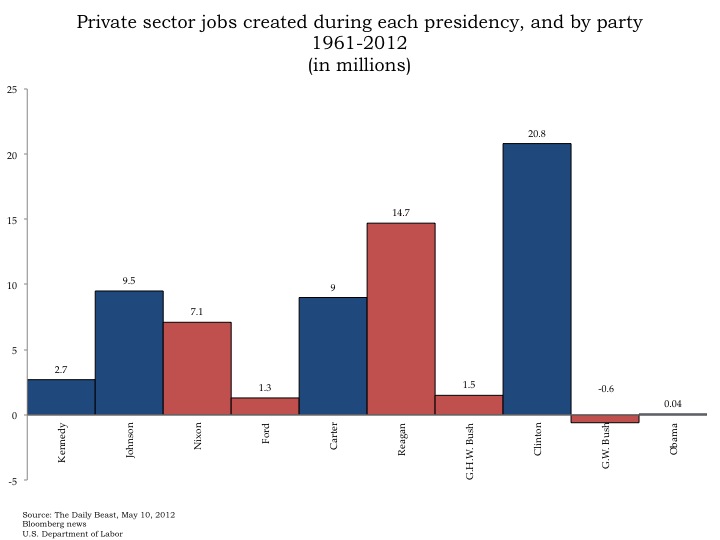 [/IMG]
[IMG] [/IMG]
 = new reply since forum marked as read
Highlight:
NoneDon't highlight anything
5 newestHighlight 5 most recent replies
= new reply since forum marked as read
Highlight:
NoneDon't highlight anything
5 newestHighlight 5 most recent replies

mikekohr
(2,312 posts)Many Americans are aware that George W. Bush has had the worst job creation record since the government began tracking these figures in 1939. But Bush's colossal failure to manage the economy overshadows a much larger story.
The record shows two unmistakable patterns:
Every time a Republican succeeds a Democrat in the White House, the job creation rate plummets.
Every time a Democrat succeeds a Republican in the White House, the job growth rate soars. Every time! No exceptions!
Considering the steady growth in population of the United States during this time frame the job creation rate should steadily increase each month (currently it must grow by 128,000 per month to keep up with population growth). This trend only manifests itself when examining Democratic administrations:
Listed below is the average job growth increase for all terms served:
http://1.bp.blogspot.com/_mHSyEv8vBt4/S6Z6xo0qSnI/AAAAAAAAACY/p8SkoEnN5dw/s640/job+creation+by+president.jpg?
By: mike kohr Graphics by: Bonny Kohr
sources:http://en.wikipedia.org/wiki/Jobs_created_during_U.S._presidential_terms
http://blogs.wsj.com/economics/2009/01/09/bush-on-jobs-the-worst-track-record-on-record/
cached at: http://bureaucountydems.blogspot.com/p/job-growth.html
Coyotl
(15,262 posts)reflects number of jobs per year for each party, instead of just the lump sum for different year numbers.

