NNadir
NNadir's JournalSo my kid is taking a Chemical Engineering course called Unit Operations and the Professor asked...
...the class to contemplate a case where a customer who had been purchasing hydrochloric acid, a side product of their process, went out of business. The professor noted that environmental regulations prevented the release of the material and that waste disposal for it costs were high.
"What do you do?" the professor asked.
Someone raised his hand and said, "Pay a lobbyist to change the environmental regulations!"
Everybody laughed, including the professor.
(My son, who says that the class consists of fellow students who have a great sense of humor.)
Everybody laughed...everybody laughed...everybody laughed...
I explained to my son that this is a very real problem. Most of the world's waste hydrochloric acid waste is deep welled.
"Wouldn't that dissolve the rock and cause problems?" my son asked. "Couldn't that cause collapse?"
"Um...um...um..." I said, and went on to apologize on behalf of my generation to his. "These are the sorts of problems you are tasked to solve," I said. I apologized again.
This, by the way, is the chemical reaction that produces polysilicon:
HSiCl3 ? Si + HCl + Cl2
The solar industry, which is a trivial industry, producing trivial amounts of energy despite more than half a century of mindless cheering for it, is a huge consumer of the explosive and corrosive gas that is the reactant in this chemistry, trichlorosilane.
Have a nice "hump day" tomorrow.
A Review of the Problem of Brine Disposal Connected With Desalination.
The scientific paper I will discuss in this post is this one: The state of desalination and brine production: A global outlook (Jones et al, Science of the Total Environment, 657 (2019) 1343–1356). It is a review article, with over 100 references to the primary scientific literature.
It is very clear to me that all efforts to address climate change have failed miserably. This failure, and indeed worldwide political and social outcomes that are actually accelerating the problem, not limited to the likes of Trump and Bolsanaro, but also including those who think that so called "renewable energy" is "green" energy and that it is a serious way to address climate change. It isn't. When one looks at the data one can see that the attempt to displace dangerous fossil fuels with so called "renewable energy" is rather the equivalent of announcing that the best way to deal with the floods associated with hurricane Katrina would have been to form a line of Louisianans stretching to New Mexico passing water filled Dixie cups to one another. The metaphor is entirely appropriate.
It's that bad.
Coupled with denial, our insistence of having faith in technologies that will not work and have experimentally demonstrated as much leaves the task of cleaning up our garbage to future generations, generations we have already robbed by the consumption (and dilution) of irreplaceable resources, thus impoverishing them.
As over my long lifetime I've grown increasingly appalled at this now inevitable environmental train wreck, and the father of two young men well along on establishing their careers, I've begun to focus my attention on the scientific investigation of technologies that may allow for the reversal of entropy associated with the accumulation of carbon dioxide in the atmosphere. With due (and great) respect to the marvelous science of people like Christopher W. Jones, (I hope to discuss the linked paper in a future post on this site), I personally believe that the key to removing carbon dioxide from the atmosphere will rely on using the oceans as an extraction device.
This technology will only be economically viable where the ocean water is also processed for other purposes, the most obvious being desalination, since an immediate effect of climate change - already being observed around the world - will be to destabilize fresh water supplies.
One should not, however, regard this technology as a "green" panacea, as people still - in spite of its obvious failure - regard so called "renewable energy" technologies like wind and solar.
The problem with desalination, as the paper referenced at the outset makes clear, is the disposal of brine.
According to the paper, there are 15,906 desalination plants operating around the world, a large fraction of them being located in the Middle East. The paper gives a nice overview of the types of technology that are employed to desalinate water, and the common abbreviations (which I will also use hereafter in this post) used to denote them:
All of these technologies require energy to operate.
For perspective, according to the paper these 15,906 plants produce roughly 95 million cubic meters of fresh water per day, which works out to 34.7 billion cubic meters per year. According to a public policy website in California, the State of California in a "wet" year, uses about 104 million "acre-feet" of water:
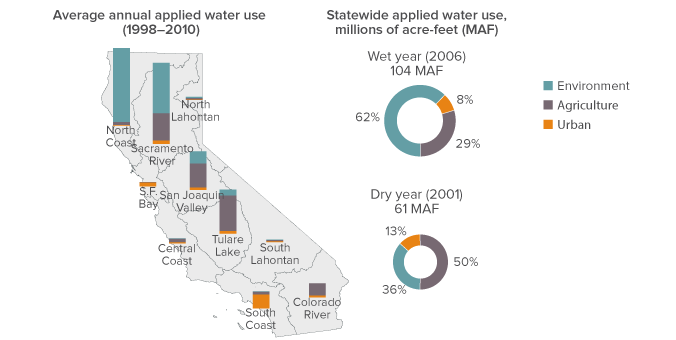
This translates to 128 billion cubic meters, meaning that all of the world's existing desalination plants produce - in the "percent talk" so loved by pixilated "renewable energy" advocates - about 27% of the water consumed in California in a flush year.
My own opinion is that from a purely environmental standpoint - albeit with several very important materials science issues being in need of consideration - those technologies that derive energy from heat, as listed above, MSF and MED, are superior, particularly if coupled with two technologies considered in the "other" category, VP and - for addressing issues with brine that the review paper discusses - FO.
It is worth noting that it seems to me at least that certain electrodialysis processes can actually recover some of the energy utilized for desalination, since an electrical current can be generated using certain kinds of membranes separating two solutions having a saline gradient, a factor that might prove worthwhile at say, oceanic outfall pipes for municipal waste water, simultaneously cleaning the water and recovering energy. I encounter papers along these lines from time to time in the journals I read, and sometimes briefly scan them; but will not discuss them further since I clearly have no serious expertise in this area.
My opinion on what might be environmentally sustainable technologies for desalination are informed by my also frequently stated opinion that nuclear energy, whether fission or in some far off future fusion, are the only sustainable technologies to address climate change, and that high temperature nuclear reactors are the best approach to the utilization of nuclear energy. High temperature reactors offer the capability of thermal desalination as a side product of isolating carbon based materials from air or seawater, a viable form of sequestration, as well as manufacturing chemical fuels where needed, thus closing the carbon cycle.
Still the paper makes clear there is a problem with brine produced by desalination, not all of which is the desalination of seawater.
The paper provides a map of desalination plants around the world, and one should immediately note that many are far from the ocean:

The caption:
This obviously implies that there are great differences in the types of water subject to "desalination" or in some cases, re-purification.
The authors provide a list, along with some useful brief comments, similar to that of the technologies in use for these feed water types:
The authors also discuss the level of scientific attention being paid to desalination technologies, some of which are clearly not mainstream but very worthy of deeper consideration. They do this by listing the number of scientific papers devoted to each type of technology.

The caption:
While it may seem that in the case of MED and MSF, the technologies in which I personally have much hope, that not much is left to be said that serious issues remain to be addressed, in particular scaling (fouling) which can have effects on both heat transfer and corrosion. These are materials science questions, and I personally support deeper research into them.
The focus of scientific papers discussing desalination is also graphed:

The caption:
Is anyone surprised at the relative position of "environmental" is in this graphic, although it must be said that the combined category of energy and economic has definite implications for environmental factors?
The number and type of desalination plants around the world are also graphed:

The caption:
An alternative graphic, including information on feedwater type is also provided.

The caption:
Nevertheless, irrespective of the technology and feed water type, a concentrated "waste" flow is produced, what the authors refer to in this paper as "brine," although the removed impurities may not be strictly limited to salts.
The authors offer a geographical graphic on the magnitude of this brine issue:

The caption:
I will plainly confess that I have not read the full paper, much less accessed the many interesting references therein, but it's certainly worth spending some time on this important issue.
My personal environmental philosophy is that there should be no such thing as "waste" of any type, or at least, to the extent possible, it should be minimized. The authors briefly suggest some approaches to utilizing "brine:"
Good stuff, probably not all that significant given the scale of the problem, but good stuff all the same.
Seawater contains a lot of valuable resources, obviously NaCl itself, but also considerable amounts of other minerals, notably magnesium, which can be a key reagent for the control of carbon dioxide and carbonates, as well as an important material for many other applications. I often note that I favor the utilization of seawater's ability to extract uranium from rock and magma, which makes nuclear fuel inexhaustible. And, most importantly, seawater contains the bulk of the free carbon dioxide on earth, both as solvated gas and in the form of carbonate and bicarbonate ions and salts.
None of this is a panacea, of course, and any such utilization needs to be conducted with careful attention to environmental issues, which are profound. Nevertheless, as said, it's a worthy consideration.
I wish you a pleasant Sunday afternoon.
An extraordinarily high neutron capture cross section has been discovered in a zirconium isotope.
The paper I'll discuss in this post is this one: The surprisingly large neutron capture cross-section of 88Zr (Jennifer A. Shusterman, et al Nature 565, 328–330 (2019) ).
(It is nice to note that 4 of the 10 authors of this paper, including the lead author, are women scientists.)
The first step I personally took in my path from being a poorly educated anti-nuke to believing - as I do now - that for the foreseeable future nuclear fission energy is the only environmentally acceptable and only sustainable form of energy there is, was when I encountered a parameter called the "neutron capture cross section" in a table of nuclides in a book that is seldom necessary to own these days (but was critical in former times), the CRC Handbook of Chemistry and Physics. I was looking at these tables because it was around the time that Chernobyl blew up, and I was trying to familiarize myself with the half-lives of some of the fission products that were in the news around that time, thinking, as proved not to be true, that these isotopes would kill hundreds of thousands of people.
If I recall correctly, the existence of this parameter, which is generally described in a parameter called "barns," immediately suggested to me at the time that it should be possible to transmute radioactive materials I then thought of as "nuclear wastes" into non-radioactive materials. I was so stupid and so ignorant that I actually thought that people were ignoring this, despite the fact that the "neutron capture cross section" and related "cross sections" such as fission, scattering, [n, 2n] etc, etc are fundamental considerations that any competent nuclear engineer must understand completely.
(The "barn" was an originally whimsical term for the apparent "target" area that an atomic nucleus represents to a neutron setting out to run into it, and probably comes from the idiom "couldn't hit the side of a barn." It's units are area, and a barn is 10^(-24) square centimeters.)
The most famous, I think, of so called "nuclear wastes" is the element cesium, in particular, the Cs-137 isotope, which has a half-life of 30.08 years It occurred to me - and it turns out fairly naively, since at the time I was as much a moron as, say, the badly educated, arrogant, and ignorant anti-nuke Harvey Wasserman - that if Cs-137 captured a neutron, as the existence of the parameter implied it could do, it would be transformed into Cs-138, which had a half-life of 33.41 minutes, decaying rapidly into the stable isotope barium-138.
This raised the question one often hears from people who think they're pretty smart but actually know nothing at all, which is "Why don't 'they' just (do x, y, or z)" as in "why don't 'they' just desalinate the ocean" (often heard in droughts) or "why don't 'they' just go solar" or "why don't 'they' just run cars on hydrogen" and so on and on...
My form was, "Why don't 'they' just have cesium-137 capture a neutron and rapidly become non-radioactive barium-137."
Now, older and wiser, I realize I should have paused to consider who "they" might be, and in consideration of this, I have been studying the work that "they" - in this case nuclear engineers and nuclear scientists - have been doing, and trust me, they have considered all the points that ignoramuses staring at the Table of Nuclides might have considered that "they" should "just" consider doing.
(Speaking of "they," this reminds me of a cute exchange I had with a dumb anti-nuke over at Daily Kos, who like many people on the left who pretend to give a shit about climate change without understanding a damned basic practical thing about the practical aspects of actually addressing it as opposed to drooling over consumer junk like Tesla cars, who arrogantly told me with a patina of schadenfreude glee , after the Fukushima event, "'They' said this could never happen!" We may take this as evidence that anti-nukes, even those who write bathos inspiring newspaper articles about historic "Navajo" (Dine) uranium miners - without considering how many human beings die every day from air pollution - seldom open a science book or a scientific paper that "they" have written. By contrast with this dumb guy, who happens to be a journalist, I read scientific papers about nuclear energy all the time, and there are many thousands of papers written about all sorts of bad things that could happen, but only do so rarely. In fact, nuclear energy is the only form of energy that was investigated for worst cases before it was constructed. We may contrast this with dangerous coal, dangerous petroleum, and dangerous natural gas, especially with respect to the latter two with “fracking,” all of which have been built without consideration of possible consequences, and indeed continue to operate without consideration of their dire observed consequences, the worst of which is climate change.
Happily for both sides, I was banned (or liberated) from Daily Kos, as I like to say, for telling the truth, and this may come under the general rubric for those familiar with Christian mythology, of "Forgive them, for they know not what they do,” – not about me, since I’m hardly even close to being Jesus – but about the unbelievable stupidity of opposing nuclear energy. Ignorance kills . It kills people since nuclear energy saves lives. This is a fact Facts matter. There is no such thing as an "alternate fact." )
Anyway, it turns out that it is not really practical to transmute cesium-137 into barium-138 in a significant way that would be worthwhile, but it really doesn't matter because it is easy (and quite possibly critical) to find uses for this wonderful isotope, more uses than those few that currently exist. Although it will always be available in limited supply, regrettably, because of a physical limitation known as the “Bateman Secular Equilibrium,” this isotope can do some pretty wonderful things connected with cleaning things up, particularly some dangerous chemical things, should we ever be serious about doing so, not that there is any evidence that we will ever be so.
The range of values for known neutron capture cross sections for the thousands of known nuclides in the Table of Nuclides goes from zero (for Helium-4) to 2,600,000 (for Xenon-135). Until the paper cited at the outset, the second highest known neutron capture cross section was 250,000 barns (for Gadolinium-157.) All of these aforementioned isotopes play a role in nuclear technology, the helium and gadolinium in some reactors, the xenon-135 is all reactors. The first, helium, has been used as a combined coolant/moderator is gas cooled reactors, the second has been used either as a “burnable poison” in fuel or in control rods. The last, xenon-135, is a radioactive fission product, generally produced as a result of the decay of iodine-135, also a fission product. It’s neutron capture cross section is so high that it is necessary to follow its accumulation – to be aware of it – and add reactivity to the core to account for it. It was first discovered with the operation of the earliest nuclear reactors utilized during the Manhattan project, and it is a credit to the genius of the early reactor designers, notably Enrico Fermi, to quickly recognize and account for its effects.
All competent nuclear engineers know all about “xenon poisoning” – the effect wherein xenon-135 can cause a reactor to shut down. It can also cause a delay in the time it takes a reactor to restart after it shuts down. Xenon-135 is usually not formed directly in nuclear fission, but is actually a decay product of another radioactive isotope which forms in the reactor, Iodine-135. This isotope has a half-life of 6.57 hours. During normal reactor operations both I-135 and Xe-135 reach secular equilibrium, the point at which they are decaying as quickly as they are formed, I-135 largely by ?- decay, and Xe-135 by a combination of neutron capture, where it is transformed into the stable (and valuable) isotope Xe-136, and by ?- decay – it’s half-life is about 9.2 hours - where it is transformed into the radioactive (but short lived, (13 day half-life roughly) isotope Cs-136, Cesium-136) which itself decays into stable Ba-136.
When a reactor shuts down and fission (except for spontaneous fission) stops, iodine-135 is no longer being formed, and equilibrium is no longer established, while xenon-135 is no longer being consumed by neutron poisoning. As the iodine-135 decays from its steady state concentration, the amount of xenon-135 increases, until it also decays. Because of the neutron absorption of these higher concentrations of xenon-135, the reactor cannot be restarted for several hours, again, as all competent nuclear engineers know.
This graph shows the effect:
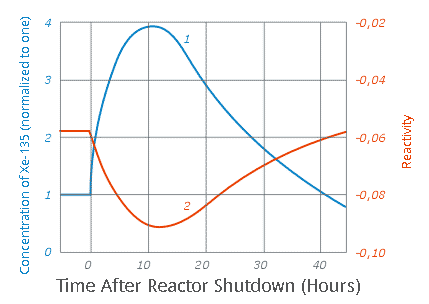
The caption:
Apparently incompetent nuclear engineers also know about “xenon” poisoning, and did something very stupid, after disabling all of a reactor's safety systems in order to overcome it. To wit:
Then the experiment began at the power level of 200 MW(th). Steam to the turbine was shut off. The diesel generators started and picked up loads. The primary coolant pumps also run down. However this led to increased steam formation as the coolant temperature was close to its boiling temperature. With its positive coolant temperature coefficient the RBMK1000 reactor now was on its way to power runaway. When the SCRAM button was pushed the control elements started to run down into the reactor core. However, due to a wrong design of the lower part of the control elements (graphite sections) the displacement of the water by graphite led to an increase of criticality. A steep power increase occurred, the core overheated causing the fuel rods to burst, leading to a large scale steam explosion and hydrogen formation...
The Severe Reactor Accidents of Three Mile Island, Chernobyl, and Fukushima
Interestingly, many people cite this event as "proof" that nuclear energy is unsafe, even though they don't announce that aircraft crashes prove that flying is unsafe, or that automotive crashes prove that cars are unsafe, or that natural gas explosions prove that dangerous natural gas is unsafe, or most interestingly, the deaths of more than 225 million people from air pollution since 1986 prove that dangerous fossil fuels are unsafe.
Selective attention I guess.
In the next 24 hours, more than 19,000 people will die from air pollution.
Global, regional, and national comparative risk assessment of 79 behavioural, environmental and occupational, and metabolic risks or clusters of risks, 1990–2015: a systematic analysis for the Global Burden of Disease Study 2015 (Lancet 2016; 388: 1659–724)
We couldn't care less.
Anyway, let’s leave those implications aside, and go to the physics. A higher neutron capture cross section than gadolinium-157 has been discovered in a nucleon, Zr-88.
From the introductory text of the paper cited at the outset:
88Zr is a neutron deficient nucleus, unlike the majority of fission products, which are generally neutron rich. However, neutron poor nuclei can be formed in high energy neutron fluxes by spallation reactions, for example, for the stable isotope 90Zr, 90Zr[n,3n]88Zr, which according to the paper, was known from underground nuclear weapons tests, in which 88Zr formed.
It should be pointed out however that in a nuclear explosion, a prompt critical event, the neutron flux is extremely high. By contrast, in a nuclear reactor, one would not expect 88Zr to form. However, were it to form, it apparently wouldn't survive very long, because, as the title indicates, the neutron capture cross section is huge. Just as the formation of 135Cs is suppressed by the enormously high capture cross section of 135Xe, which is normally rapidly depleted at a rate dwarfing its (short) half-life, so would any 88Zr formed be eliminated.
For the experiment, 88Zr was not made by neutron induced reactions, but rather in a cyclotron by proton bombardment:
Cool.
Figure 1:
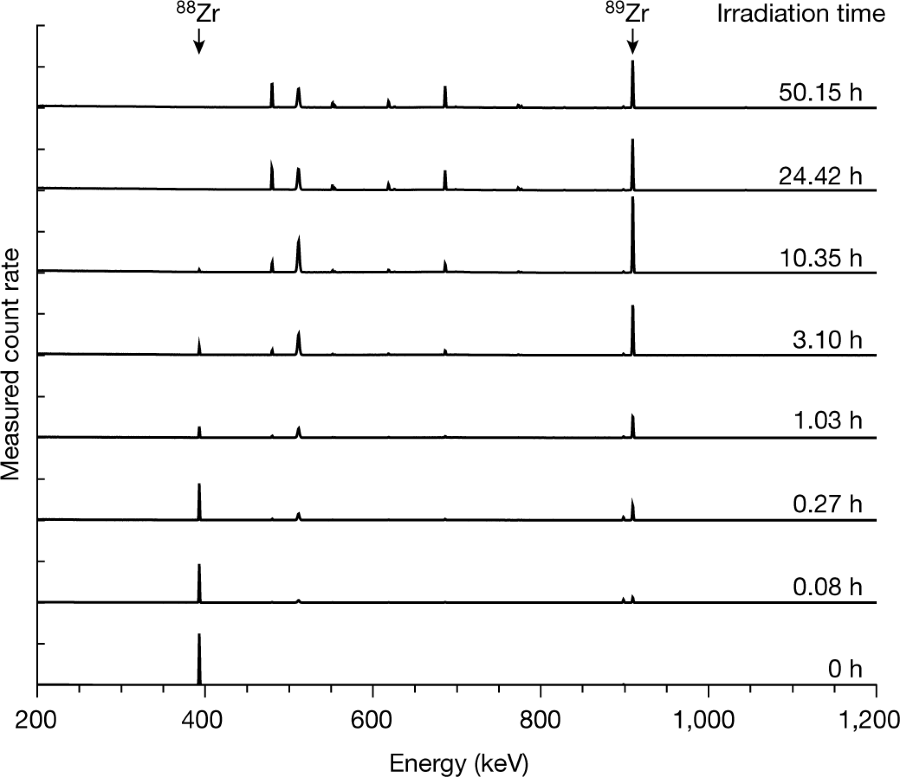
The caption:
From the calculated flux in the Missouri University Research reactor, the neutron capture cross section was derived from the following curves:
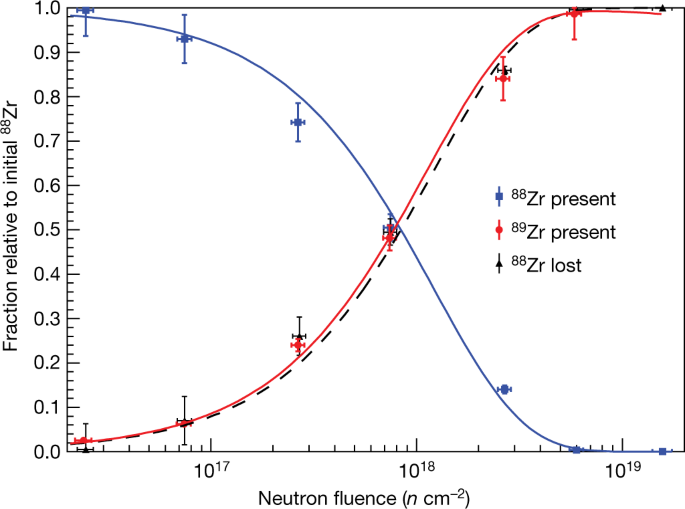
The caption:
A graphic of the determined neutron capture cross sections, with an inset for the known cross sections for "normal" nucleons.
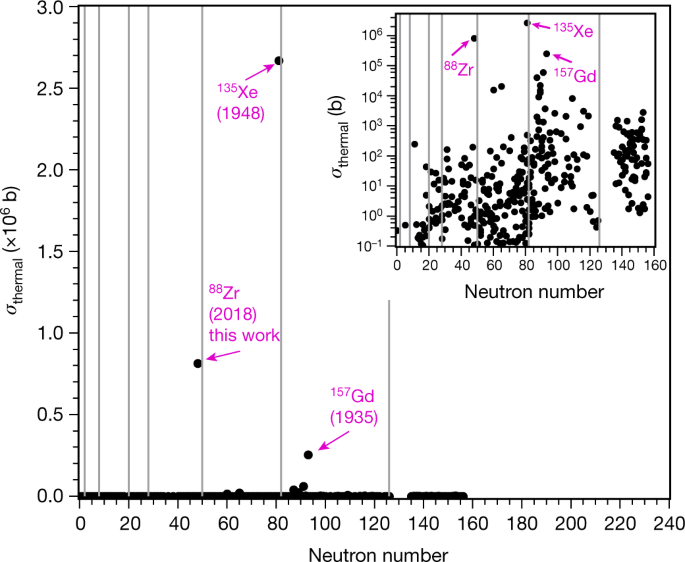
The caption:
It is interesting to note that many of the highest neutron capture cross sections exist in nuclei having neutron numbers that correspond roughly to the lanthanide elements. Some of these, at least the lighter lanthanides, are prominent fission products. In fact in solid fueled nuclear reactors, the fuel stops functioning well before the fissionable nuclei in it are consumed. This is because of the accumulation of highly neutron absorbing isotopes of elements like samarium, and to a lesser extent, europium and even promethium (as well as some other elements). This suggests that in a sensible world where people give a rat's ass about climate change - which is clearly not the world in which we live - that elements of used nuclear fuel might displace the elements now utilized in control rods, to adjust reactivity in fuel cores, since, despite what you may have heard, nuclear energy is the only form of energy that is scalable enough, sustainable enough and safe enough to address climate change.
Another interesting point suggested by the information above is a comment on the "reality" of concepts like "area" in the case of atomic nuclei. Above I indicated that a "barn" was a unit of area that is 10^(-24) cm^2 (10^(-28) m^2). If one does some simple, but naive calculations this suggests that a mole of xenon-135, (roughly 135 grams) should have, as a consequence of its neutron capture cross section of 2,600,000 barns, a combined nuclear area of around 156 square meters. Of course this is not observed. Although most - certainly among chemists - scientists tend to think of quantum effects involving electrons, which are fermions best described by wave functions subject to the Pauli exclusion principle...
(This text, excepted immediately below from the original form of this post, is wrong, as was pointed out in comments below by a correspondent. Both neutrons and protons are Fermions, and the Paui Exclusion Principle applies. On reflection, this should have been obvious to me, given that transitions between nuclear isomers is usually "monochromatic. For example, the decay of radioactive Ba-137m to stable Ba-137, a feature of the decay series of Cs-137 - and accounting for the gamma output of this series - always releases radiation with an energy of 661.659 keV. This would not be the case for a Bose-Einstein system. I thank the correspondent for the correction from which I learned two things, the fact of the matter, and not to rely too much on memory. The correspondent also pointing out that Wigner won his Nobel for the nuclear shell model by which this system operates.)
Nevertheless, like all quantum phenomena, a nucleus has a wave function and should not be thought of as strictly particulate in nature. In fact, the neutron capture cross section is best described in a "center of mass" frame and not a laboratory frame, and a neutron about to collide with a nucleus is in fact a system, as opposed to to "particles" colliding. This wave function is thus a function of the energy of a system: The apparent "size" at which a neutron "sees" a nucleus as having depends on the energy (the velocity) the neutron possesses with respect to the target nuclei. The 2,600,000 barn figure for Xe-135 is only true for "thermal" neutrons, generally taken to be neutrons with an average energy of 0.253 eV. Despite the units of area, a nucleus is neither a thing nor a wave, but both.
(Eugene Wigner, co-developer of the formula above for neutron capture resonances, and also a Nobel Laureate, co-wrote with Alvin Weinberg, the first nuclear engineering textbook, in 1956. I believe it's still in print. The technical basis of most of the world's operating reactors was based on technology known in the 1950s and 1960s.)
The ideas around neutron cross sections have been floating in my brain for several decades now, and I was intrigued by this interesting paper which showed up just recently in Nature. Papers on this topic always grab my attention when I see them.
I wish you a pleasant Sunday.
Wouldn't you agree that it's time we had a smooth function...
...that we use "to switch between the low pressure Sips and the high pressure Langmuir–Henry isotherms"?
Well here it is:

Beautiful little thing, isn't it?
Comes from a paper by Christopher Jones at GA Tech, a man working to leave future generations something by which they may save themselves from what we have done to them.
Sorry kids, but at least you have this:
Moving Beyond Adsorption Capacity in Design of Adsorbents for CO2 Capture from Ultradilute Feeds: Kinetics of CO2 Adsorption in Materials with Stepped Isotherms
I love looking at equations that look like that little parameter.
It's a beautiful thing, esoteric, but very beautiful all the same.
Trust me. It is.
I had no idea that Trump had British relatives, and that these relatives visited New Zealand.
Tourists From Hell Visit New Zealand And The Whole Country Unites Against ThemTwo nice boys playing Cello.
Government for the people, BY the people, FOR the people, OF the people, HAS vanished.
What we can say about James Buchanan, who was generally considered the worst President in US history, was a least the crisis that he failed miserably to address, the horror of human slavery, existed before he took office.
There had been many threats to break up the Union because Southern racists hated and exploited African Americans with more enthusiasm than they loved their country, just as Trump today hates Mexicans more than he loves Americans. (He loves nothing, save his withered self.)
It was fortunate that the United States has a man like Lincoln - from whose famous Gettysburg address the title here, of course, is modified - to succeed Buchanan.
Lincoln of course, cared what history would think of him, and Lincoln had something missing today in the party he helped found, intelligence and integrity and patriotism.
The two new candidates for succeed Buchanan in the minds of future historians, should historians exist, Trump and Bush Jr, manufactured crises, Bush in Iraq, Trump, even more mindlessly, at the Mexican border.
When Trump is done, I should not be surprised if the Mexican army could kick down the walls, take back Texas, New Mexico, Arizona and California, he is so weak, so ignorant, so vicious.
He is destroying this government, with the complicity of many of those in it. It is interesting that the same general area responsible for the Civil War, is also responsible for the destruction of the American Government 150 years after the fact.
Carbon Dioxide, Oxygen Depletion, and the Mass Extinction in the Permian Era.
The paper I'll discuss in this post is this one: Temperature-dependent hypoxia explains biogeography and severity of end-Permian marine mass extinction (Penn et al, Science, (2018) Vol. 362, Issue 6419, eaat1327).
This paper is the source material for a news article which came to my attention by a post here: Stanford Study: We Will Be 20% Of The Way To Permian Extinction 2.0 By 2100 With Business As Usual
From the introduction:
In this study, we tested whether rapid greenhouse warming and the accompanying loss of ocean O2—the two best-supported aspects of end- Permian environmental change—can together account for the magnitude and biogeographic selectivity of end-Permianmass extinction in the oceans. Specifically, we simulated global warming across the Permian/Triassic (P/Tr) transition using a model of Earth’s climate and coupled biogeochemical cycles, validated with geochemical data.
This is an in silico evaluation, since the experimental loading of the entire atmosphere with excess carbon dioxide, while well underway, has not been completed, although some preliminary intermediate results are currently being observed. The experimental portion of the work described herein - other than burning all of the world's fossil fuels and dumping the waste in the atmosphere just described - is limited to viewing the metabolic effects of oxygen depletion on extant species. (Trilobites were not available for testing.) The in silico data is also compared with the fossil record, including oxygen isotope ratios in fossil conodonts, eel like animals that lived in those time, generally known from fossils of their teeth.
The following graphic from the paper touches on that point:
 ?width=800&height=600&carousel=1
The caption:
(A) Map of near-surface (0 to 70 m) ocean warming across the Permian/Triassic (P/Tr) transition simulated in the Community Earth System Model. The region in gray represents the supercontinent Pangaea. (B) Simulated near-surface ocean temperatures (red circles) in the eastern Paleo-Tethys (5°S to 20°N) and reconstructed from conodont ?18O apatite measurements (black circles) (4). The time scale of the ?18O apatite data (circles) has been shifted by 700,000 years to align it with ?18Oapatite calibrated by U-Pb zircon dates (open triangles) (1), which also define the extinction interval (gray band). Error bars are 1°C. (C) Simulated zonal mean ocean warming (°C) across the P/Tr transition. (D) Map of seafloor oxygen levels in the Triassic simulation. Hatching indicates anoxic regions (O2 < 5 mmol/m^3). (E) Simulated seafloor anoxic fraction ƒanox (red circles). Simulated values are used to drive a published one-box ocean model of the ocean’s uranium cycle (8) and are compared to ?238U isotope measurements of marine carbonates formed in the Paleo-Tethys (black circles). Error bars are 0.1‰. (F) Same as in (C) but for simulated changes in O2 concentrations (mmol/m^3).
The test animal used to perhaps model metabolism is the common crab found along the East Coast of North America Cancer irroratus. Crustaceans, like the trilobites, which inhabited the oceans for 280 million years before their extinction in this event, are members of the phylum Euarthropoda (Arthropods) and like the trilobites, feature an exoskeleton that probably was fairly acid sensitive. It is not clear that the extinction of the trilobites was a function of increased acidity owing to the carbon dioxide content of the oceans, or whether it derived from oxygen depletion or perhaps both. The authors discuss this briefly in the discussion, but in a rather general and somewhat speculative way.
With this editor and the type of text used by Science I cannot produce the equation for the "metabolic index" used here, but for those with a modicum of a science back ground, this index is proportional to the partial pressure of oxygen divided by a term that looks very much like an Arrhenius term, an exponential operator on the negative value of energy (here measured in electron-volts), divided by the Boltzman constant (R/No) times the difference between reciprocal temperatures. The proportionality constant has units of inverse pressure and therefore the metabolic index, ?, is dimensionless. This metabolic index (which differs from what your fitbit might put out or what you can see on a "lose your fat and look good" website) is described here: Climate change tightens a metabolic constraint on marine habitats, which seems to be along the same lines as the paper under discussion.
A graphic about the metabolic index:
 ?width=800&height=600&carousel=1
The caption:
(A) The critical O2 pressure (pO2crit) needed to sustain resting metabolic rates in laboratory experiments (red circles, Cancer irroratus) vary with temperature with a slope proportional to Eo from a value of 1/Ao at a reference temperature (Tref), as estimated by linear regression when ? = 1 (19). Energetic demands for ecological activity increase hypoxic thresholds by a factor ?crit above the resting state, a value estimated from the Metabolic Index at a species’ observed habitat range limit. (B) Zonal mean distribution of ? in the Permian simulation for ecophysiotypes with average 1/Ao and Eo (~4.5 kPa and 0.4 eV, respectively). (C and D) Variations in ? for an ecophysiotype with weak (C) and strong (D) temperature sensitivities (Eo = 0 eV and 1.0 eV, respectively), both with 1/Ao ~ 4.5 kPa. Example values of ?crit (black lines) outline different distributions of available aerobic habitat for a given combination of 1/Ao and Eo.
Text touching on the metabolic index is this paper:
The graphic immediately following the one above:
 ?width=800&height=600&carousel=1
The caption:
(A) Percentage of ocean volume in the upper 1000 m that is viable aerobic habitat (? ? ?crit) in the Permian for ecophysiotypes with different hypoxic threshold parameters 1/Ao and temperature sensitivities Eo. (B) Relative (percent) change in Permian aerobic habitat volume (?Vi, where i is an index of ecophysiotype) under Triassic warming and O2 loss. Colored contours are for ecophysiotypes with ?crit = 3. Measured values of 1/Ao and Eo in modern species are shown as black symbols, but in (B) these are colored according to habitat changes at a species’ specific ?crit where an estimate of this parameter is available. The gray region at upper left indicates trait combinations for which no habitat is available in the Permian simulation.
Some information about the distribution of oxygen depletion in the oceans:
 ?width=800&height=600&carousel=1
The authors conclude with somewhat obvious remarks on the relevance of this study to the present times:
But you already knew that, didn't you?
To be clear, this paper refers to oxygen in the oceans, and not the atmosphere. Almost all of the oxygen now on earth originates in the oceans, but it's not clear how it partitions between the oceans and the air. In general, gases are less soluble in hot water than in cold water, as is clear to anyone who's messed around with carbonated beverages, but I'm not aware in any quantitative sense of how these solubility relations relate to oxygen as compared with carbon dioxide. (The latter is controlled, in water, by the equilibrium between solvated CO2, its water adduct, carbonic acid, bicarbonate and carbonate, all of which are present.) It is quite possible that the warm surface layers, rich with algae or other photosynthetic species, cranked out lots of oxygen after the Permian extinction, but that it all went into the air and did not remain in the ocean.
(From the text of the paper, one factor seems to have been the circulation patterns of oceanic water, which were arrested by the heating.)
I didn't mean to divert your attention from all the hoopla surrounding the orange fool, but frankly, he doesn't matter and has never mattered, and his ultimate significance will prove to be that of Caligula, so much as Caligula matters today - he doesn't - except for the amusing historical fact that Caligula put a horse in the Senate and the orange idiot has a turtle in the Senate.
Same difference.
Have a nice day tomorrow.
Metal Free Thermochemical Water Splitting at Unusually Mild Conditions.
The paper I'll discuss in this post is this one: Phosphorus-Doped Graphene as a Metal-Free Material for Thermochemical Water Reforming at Unusually Mild Conditions (Garcia et al ACS Sustainable Chem. Eng., 2019, 7 (1), pp 838–846.
Recently in this space I discussed the thermochemical splitting of carbon dioxide (into CO and O2 gases) using a cerium oxide based catalyst in which the oxygen evolution reaction took place at 1400C, showing that there is - as currently operated using "simulated solar energy" - not enough cerium on earth to split one billion tons of carbon dioxide, using either solar thermal or nuclear energy (although nuclear is considerably less onerous in terms of putative cerium demands). One billion tons of carbon dioxide about 3% of what we currently dump each year into the planetary atmosphere.
Here's that post: Cerium Requirements to Split One Billion Tons of Carbon Dioxide, the Nuclear v Solar Thermal cases
From my perspective, the thermochemical splitting of either carbon dioxide or water is probably the only serious manner in which climate change can be reversed, and even if taken seriously - there are few people on this planet left or right who are serious about addressing climate change - it would still be a long shot, but, as the only shot with a modicum of probable success, one worth taking.
Scientists however, continue to work on the problem.
I have spent many years considering thermochemical cycles for splitting either water or carbon dioxide using nuclear energy (or less seriously solar thermal energy), and most, with a few exceptions, involve metals - the main exception being the famous sulfur iodine cycle (which has metal based modifications however) - my personal favorite being the zinc oxide cycle for reasons I won't go into here. The one I'll discuss here - it's really a half reaction, not a full cyclic reaction - is new to me, I must admit. It clearly is not scalable or even worthy of consideration of scale, but the research is extremely interesting and certainly comes under the rubric of "a good lead," particularly since the required temperatures for hydrogen evolution are unusually low, about 900 C.
This involves an interesting material, graphene, which has been the subject of huge amounts of research in materials science.
From the introduction:
figure
Scheme 1. Process of Preparation of r-GO from Graphite Involving Oxidation to Graphite Oxide and Exfoliation to GOa
a(i) Chemical oxidation, (ii) exfoliation, and (iii) chemical reduction.
The above process to perform graphite exfoliation by conversion of graphene (G) into GO is based on the possibility of carrying out the oxidation and reduction of G/GO, increasing the oxygen content to above 50 wt % from G to GO, with a certain degree of control, and then, subsequently decreasing this oxygen content from 50 to about 10 wt %, which is characteristic of r-GO. This ability to increase and decrease the oxygen content on G sheets is reminiscent of the so-called Mars van Krevelen oxidation/reduction of nonstoichiometric transition metal oxides, in where the oxygen content of the inorganic oxide can be varied to a certain extent, generally much lower than the one commented in the case of G/GO/r-GO.(3) This Mars van Krevelen mechanism has been, however, advantageously used to promote catalytic oxidations/reductions, and more related to the present work, this swing between the two related materials with different oxygen contents is at the base of the thermochemical cycles for water splitting or steam reforming.
In steam reforming, a substrate (S) promotes the reduction of water, resulting in the generation of hydrogen (eq 1) and substrate oxidation. If the oxidized form of the substrate, most frequently inorganic oxides (for instance ceria, perovskites, or spinel ferrites) due to the required thermal stability (T = 1300–1500 °C), can subsequently be thermally reduced by oxygen evolution (eq 2), then the two steps can serve to perform cyclically the overall water splitting.(4,5) It has been reported, that one of the main challenges in thermochemical water reforming is the development of materials able to promote efficiently thermochemical transformations at low temperatures (<1100 °C), especially for large scale production.(5?7)
Graphene is a form of carbon in which all of the carbon atoms are bonded together in a plane, which is also characteristic of graphite, but unlike graphite, the graphene is exactly one atom thick. The layers are not connected.
What is interesting here is that the carbon source for the graphene is biomass, as opposed to a dangerous fossil fuel source, meaning that it is possible that this approach is sustainable, at least on a moderate scale.
One source is alginic acid, which is obtained from brown algae, many species of which are believed to be excellent tools for carbon capture from the atmosphere. The other is phytic acid, which is per-phosphorylated inositol, which is found in beans, and notably in manure, where it is responsible for the environmentally problematic concentration of phosphorous.
Graphene in the presence of steam is reformed normally, yielding carbon dioxide and hydrogen - and the reforming of biomass is probably an excellent approach to carbon capture as well as thermochemical splitting - however there are certain mineral considerations that represent significant hurdles.
In order to prevent the reformation of graphene, the authors here have phosphorylated graphene oxide.
Some pictures from the paper, first the synthesis of the graphene (and its oxide):

The caption:
Scheme 1. Process of Preparation of r-GO from Graphite Involving Oxidation to Graphite Oxide and Exfoliation to GO
(i) Chemical oxidation, (ii) exfoliation, and (iii) chemical reduction.
Next, the xray photoelectron spectrum (XPS) of the graphene:

The caption:
The chemical nature of the phosphorous attached to the graphene can be discerned from nuclear magnetic resonance spectrometry (NMR) since the only isotope of phosphorous that occurs naturally, 31P, is magnetically active. The 31P spectrum:

The caption:
"Phy-G" is phosphorous doped graphene.
High resolution tunneling electron microscope images:

Atomic force microscope images:
The caption:
The hydrogen evolution over 21 cycles:
The caption:
The authors do some in silico calculations. Here's some fun details of their approach:
Here's what they found:

The caption:
Of course the main problem with this system is that oxygen is not evolved, the reduction of water to hydrogen is first accomplished by the oxidation of phosphorous, and finally, after a number of cycles, to the oxidation of the graphene, that is, ultimate reformation.
The authors write:
It is worth noting, that evolution of O2 was not detected in any step in these experiments, either using Phy-G or G, indicating that eq 2 does not take place. However, since H2 evolves in the hydrolysis steps, it is clear that the O atoms present in H2O must remain attached in the Phy-G catalyst or could promote some decomposition. In order to address the nature of the oxygenated groups being formed on Phy-G, Raman spectroscopy and XPS analysis of the Phy-G catalyst after extensive use in the thermochemical H2O reactions were carried out.
The XPS P 2p peaks of Phy-G, after its use in steam reforming and its best deconvolution fit, are presented as Figure 7, which also provides a comparison with the P 2p peak of the fresh sample. The first information provided by XPS was a decrease in the proportion of P quantified by the decrease of the P/C atomic ratio from the initial 0.072 value for the fresh Phy-G material to the 0.021 ratio determined for the Phy-G sample after its use in the thermochemical H2 generation from H2O. Comparison of P 2p spectra of fresh and used Phy-G confirms a shift in the P 2p peak of the used Phy-G toward higher binding energies, indicating the increasing presence of oxidized P in the catalyst composition. In addition, as it can be observed in Figure 7, the P 2p peak of Phy-G after the reaction presents only two main components instead of three. In this case, the component at 132 eV, related to the P–C bond, is no longer present, while components at 134 and 136 eV in relative percentages of 74.5 and 25.5%, respectively, are related to the formation of the P–O bonds...
...The solid-state 31P NMR spectra of fresh and used Phy-G have been similarly recorded, and they are compared in Figure S7. As it can be seen there, the contribution of peaks corresponding to triphenylphosphine and triphenylphosphine oxide has considerably decreased, while the peaks attributed to phosphate and other P oxide groups have undergone a notable increase in good agreement with the information provided by XP and Raman spectroscopies. Therefore, the incorporation of O atoms in P-doped G as phosphate groups is confirmed by three different techniques, and thus, the lack of O2 gas in the stream can be attributed to the oxophilic nature of P and also, to some degree, of graphenic C oxidation during reaction. Observation of CH4 and CO in the thermochemical cycles clearly indicates this gradual oxidation of G, since it is the most likely origin of CH4 is methanation of CO2.
Nevertheless, a cool paper, and quite interesting for the development of future catalytic systems.
An excerpt of the paper's conclusion:
Have a nice day tomorrow.
Reaching the end of a job interview, the Human Resources Manager asked the young engineer...
...fresh out of the university, , "And what starting salary were you looking for?"
The engineer said, "In the neighborhood of $100,000 a year, depending on the benefit's package."
The HR Manager said, "Well, what would you say to a package of $200,000 a year, 5 weeks vacation, 14 paid holidays, full medical and dental, company matching retirement fund to 50% of salary, and a company car leased every 2 years - say, a red Mercedes?"
The engineer sat up straight and said, "Wow!!! Are you joking?"
And the HR Manager said, "Of course, ...but you started it."
Profile Information
Gender: MaleCurrent location: New Jersey
Member since: 2002
Number of posts: 33,513