NNadir
NNadir's JournalWell, I would certainly disagree with your contention in this post.
This one, specifically:
Nothing in your argument in this space in any way dissuades me from this deeply held opinion to the contrary. I have yet to meet an anti-nuke who I would regard as being anything other than stupid.
Now, of course, if one were to look through my journal on this site, one might find support for a claim that somewhere, roughly, between 50 and 75% of what I write refers to the primary scientific literature.
If one were to read through my writings, one might see that I often admire what's written, but also that there are many instances where I have disagreements with the contents of a paper, and often make comments along these lines. Sometimes I don't comment in writing, but nonetheless, even if admire the general content of a paper, I emphatically disagree with the putative rationale for which the paper is written.
Over the years, if not here, than certainly elsewhere, I've commented on PNAS papers, although frankly PNAS is somewhat lower on my reading list than other journals that better reflect my general interests.
For instance, today in "prestigious" journal Nature, to which I am a subscriber, I came across this paper, which on one level I admire: Ceramic–metal composites for heat exchangers in concentrated solar power plants (Sandhage et al Nature Volume 562, pages 406–409 (2018))
The paper, is an excellent Materials Science paper, and features this very impressive graphic:
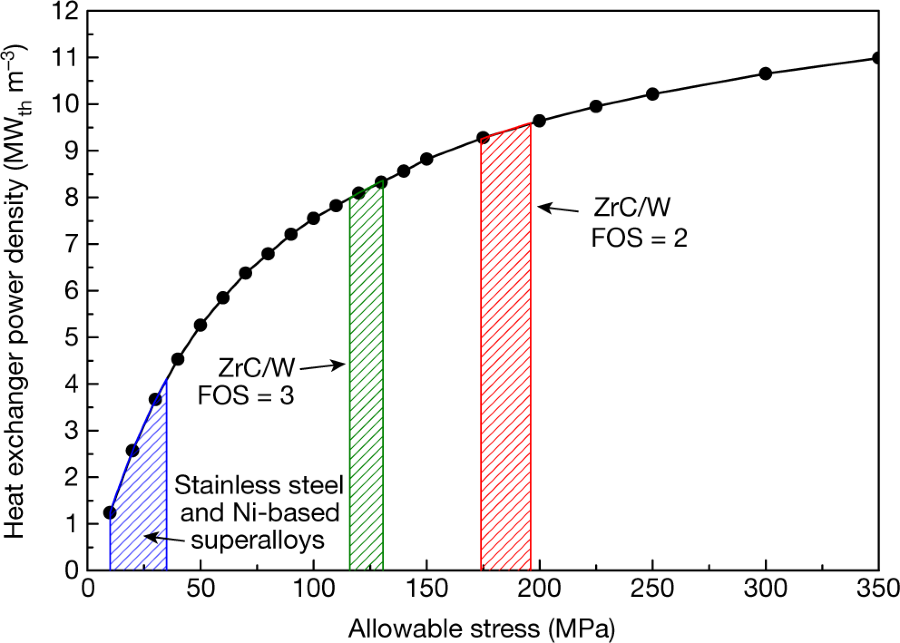
The caption:
Excellent. I love papers like this about refractory high temperature heat transfer materials. In a world inhabited by and run by intelligent people, this basic materials science would have outstanding applications in the nuclear industry.
Of course, this does not imply that I think that the title of this wonderful paper makes any sense at all, although I would have no doubt that a dumb ass anti-nuke who can't read very well might misread this paper as a statement that solar concentrators will work and are a done deal.
By contrast, someone who thinks critically might note that there are literally thousands of papers over the decades - I'm sure I've personally seen upwards of a thousand myself - on solar thermal refractories, but nonetheless, the solar thermal industry as a whole has been as useless - maybe even more useless, more destructive, and more wasteful than the rest of the solar industry on which we bet the planetary atmosphere, with future generations forced to pay the debt for the fact, that the bet has been lost.
I don't expect anyone with the mentality of an anti-nuke to get this, but the average data for the week ending April 22, 2018 showed a concentration of carbon dioxide in the atmosphere hit 411.68.
This is after the world spent 2.2 trillion dollars in the period between 2007 and 2017 on solar and wind alone:
Frankfurt School/UNEP Global Renewable Energy Investment, 2018, Figure 3, page 14
I hold anti-nukes and their weak minds responsible for this outcome. Now, it would be unsurprising to find an anti-nuke to disagree with this. Of course, these are people who had a outrageous knee jerk reaction to Fukushima - ignoring that most people killed in the event were killed by seawater and comparatively few were actually killed by radiation - and burned gas to carry on about the reactors.
(How many people died from radiation again?)
Thus I feel absolutely free to state that even if the basic science in the paper I just cited above is excellent, the title is nonsense. Of course, it is not necessarily the case that the authors are all that attached to the title. It's quite possible that the title reflects nothing more than a requirement attached to it by the people providing the grant, which was, as it happens, the DOE Office of Renewable Energy and Efficiency.
There's only one minor problem with the political existence of this office: So called "renewable energy" hasn't worked; it isn't working; and it won't work. And while they do fund good papers like this one on mixed zirconium/tunsten carbide materials, the requirement that the title include an obvious nonsense statement does no good for humanity or the planet.
The world is dying, and solar thermal plants will do nothing to stop it.
Now the fact that there is a DOE Office of Renewable Energy reflects a political fact (just, as I will argue below) as the open sourced PNAS paper linked in the OP doesn't reflect a technical argument about nuclear power, but reflects a sociopolitical statement which arguably the authors find regrettable when they write, referring to the now discredited (by events) Pacala and Socolow paper from 2004 in the prestigious journal Science:
Nuclear power is one of those technologies. For several years, we have been evaluating the potential role that new nuclear power technologies might play in this decarbonization by conducting a variety of studies that investigate the technical, economic, and political challenges that face it, both in the United States and around the world. We have concluded that, barring some dramatic policy changes, it is most unlikely that nuclear power will be able to contribute to decarbonization in the United States, much less provide a new carbon-free wedge on the critical time scale of the next several decades. With the exception of a few other nations, including China, the same may also be true across the rest of the world.
The discredited (by events, we hit more than 411 ppm this year, 14 years after the paper was written) Socolow and Pacala paper is reference 8. The bold is mine.
Policy changes...
Political challenges...
Again, the United States built more than 100 reactors 30 or 40 years ago using technology from the 1950's. I note that anti-nukes are notorious for changing the subject when asked, point blank, to address this point, and start whining, for instance, about the prestige of journals or some such equally absurd thing.
In saying this, I'm not knocking PNAS, or the authors published in PNAS, although I will point shortly to an author published in PNAS - an anti-nuke - who I decidedly view as an idiot.
Of course, since I have no respect at all for the intellectual integrity - or for that matter the ethical integrity - of anti-nukes, I'm unsurprised that they can't read any better than they can think. Good thinking is often attached to good reading skills, but anti-nukes neither read, think or speak well. They just repeat cant, slogans and scare stories that do not focus at all on what is really scary, that being climate change.
Now, let's turn to the claim that I have dissed the authors of this particular PNAS paper because I don't find their argument compelling or wise.
Publications in peer reviewed journals are not true or false because of the prestige of the journal. Here for instance is the retraction page for Nature:
Nature: Retractions
Here is the retraction page for PNAS:
Retractions, PNAS
In pointing to these retractions - at the risk of hearing a distorted reading of the point by a dumb anti-nuke - I am not stating that the PNAS paper referenced in the OP should be subject to such a retraction. Many of the statements in it are true.
They state the following:
The bolded statement is true, but a better paper would ask why gas prices are low; and note that one factor allowing for these putative "low costs" is that the owners of gas plants are absolutely free, without charge, and with due contempt for all future generations, allowed to indiscriminately dump all of their waste directly into the planetary atmosphere, where it migrates to the ocean and other bodies of water acidifying them.
If the gas industry were required to meet the requirements artificially set for the nuclear industry - that it prove that no one ever at any time be injured at all by any of its operations lest jerk-off knee jerk anti-nuke assholes get themselves into full twittery on the internet - it would collapse in a New York minute, and along with it the so called "renewable energy" industry that serves as the gas industry's marketing tool.
If the natural gas industry needed to pay, as I noted in the text generating this benighted comment to which I now respond, a carbon tax commensurate with the damage it causes in climate change related effects, it would collapse in a New York minute.
I note people get blown up all the time by gas explosions and still anti-nukes burn electricity generated by burning natural gas to publish their bullshit about Fukushima and Chernobyl, this on a planet, as I often point out, where 70 million people, more or less, have died in the last ten years, from air pollution.
A comparative risk assessment of burden of disease and injury attributable to 67 risk factors and risk factor clusters in 21 regions, 1990–2010: a systematic analysis for the Global Burden of Disease Study 2010 (Lancet 2012, 380, 2224–60: For air pollution mortality figures see Table 3, page 2238 and the text on page 2240.)
(An updated version of this study has been published, but I haven't read it in its entirely yet. It suggests, however, that air pollution deaths are climbing outdoors and climbing over all, although indoor air pollution deaths have decrease slightly owing to improved home ventilation and improved stoves for impoverished people.)
In short, the reason that gas prices are low is because every damn living thing on the planet is required, without consent, to bear the external cost.
This paper makes a statement this is apparently true - the internal cost of gas is (temporarily) low - but ignores the fact that gas is actually extremely expensive because of its external costs.
It is, by comparison, not true that the external costs of nuclear power even remotely approximate the external costs of natural gas. There are thousands of papers showing as much.
So, to approach the conclusion, if one claims that something is true because it is published in a prestigious (or any peer reviewed) journal, one is merely showing a very, very, very, very, very weak understanding of science, something I note about every pixilated and confused anti-nuke whose drivel I find myself hearing.
This is why many very good journals feature sections wherein a scientist may comment on the quality or connection to the truth of a paper published after peer review in that journal.
For example, here is the Nobel Laureate Burton Richter commenting on a paper written by the anti-nuke Stanford Professor Mark Z. Jacobson, who I regard, at the risk of being sued apparently, as a complete fool.
Jacobson wrote this paper claiming, among other things, that the reactor at Diablo Canyon represented a real threat to be another Fukushima:Worldwide health effects of the Fukushima Daiichi nuclear accident
Richter responded, as noted by other highly intelligent people, that even in light of Fukushima, nuclear power in Japan saved lives. He also noted a fact which knee jerk anti-nukes couldn't care less about, that most people died from seawater, not that anti-nukes give a rat's ass about climate change.
Opinion on “Worldwide health effects of the Fukushima Daiichi nuclear accident” by J. E. Ten Hoeve and M. Z. Jacobson, Energy Environ. Sci., 2012, 5, DOI: 10.1039/c2ee22019a
The mild remonstrance from a Nobel Laureate didn't stop Jacobson of course from prattling on with delusional rhetoric however. He went on to publish this in, um, PNAS:
Low-cost solution to the grid reliability problem with 100% penetration of intermittent wind, water, and solar for all purposes
I've been hearing this 100% renewable crap my whole damned life, and publication of nonsense like this in PNAS in no way changes what I observe and which is widely reported: Solar and wind combined, after half a century of mindless cheering, didn't produce 10 of the 576 exajoules of energy humanity was consuming as of 2016.
Other scientists apparently felt similarly, and published in PNAS the following paper, questioning his analysis:
Evaluation of a proposal for reliable low-cost grid power with 100% wind, water, and solar.
There's something like 20 authors listed, some from Jacobson's own institution.
They wrote, correctly in my view, although I quibble with many of their comments:
Jacobson, showing his deep respect for science, rather than respond in a journal, filed a $10,000,000 lawsuit against PNAS and the authors of the paper: Jacobson v. National Academy of Sciences
He later dropped his suit, bitching and moaning all the way: A Stanford professor drops his ridiculous defamation lawsuit against his scientific critics
Of course, the whole affair is entirely consistent with my view of anti-nukes in general. I regard them as very poor thinkers, with dangerous obsessions and poor quality arguments that focus on minutiae at the expense of the grand reality, which is that climate change is real, that it matters, and that reality matters.
Oh, and I would make a note of something that troubles me in this age of Trumpism. It does seem to me that a lot of people are latching on to the word "fake" used by the Idiot in Chief.
I note that in mimicking this small minded and rather dangerous man, they are ignoring that he uses the word whenever he is about to tell a lie or to grotesquely misrepresent a fact.
It is entirely unsurprising to see that many of the people who adopt this absurd usage are definitely and clearly in his intellectual league.
Have a wonderful day tomorrow.
We seem to have hit the carbon dioxide minimum for 2018 at Mauna Loa.
Atmospheric concentrations of CO2, as many people know, follows a sinusoidal curve where the ordinate axis may be crudely approximated as a monotonically increasing straight line rotated from the zero axis:

The slope of this rotating axis line - using weekly data going back to the first week of October, 2000 is 2.16 ppm/year.
The slope of the rotated axis line since NOAA began publishing weekly data in 1975, from the second week of October 1975 (the data is missing for the first week of that year) to October of 2000 was 1.53 ppm/year.
The slope of the rotated axis line since the first week October of 2008 to now is 2.23.
In other words the "straight line" is bent; things are getting worse, not better.
The change for this year - a mild carbon year since it's post-El Nino year - from last year's minimum is 2.20. The minimum this year seems to have occurred in the week ending September 30, 2018. We were at 405.5 ppm. No one now living will ever see a measurement below again in their lifetime again.
We're doing great!!!!:
"Percent solar," "percent, wind," "Tesla electric car!" "100% renewable by 2050 or 2060 or 2070 or 2100 or whatever," and so on...
Al Gore spoke of the frog in a pot being heated to boiling having a very different reaction than a frog being into a pot that is already boiling..
We've been in this pot for many, many, many decades, and are accepting the heat at great risk to the future.
And I'm sorry, but "Percent solar," "percent, wind," "Tesla electric car!" "100% renewable by 2050 or 2060 or 2070 or 2100"...blah...blah...blah...
...hasn't worked, isn't working, and most importantly won't work.
The first step will be to stop lying to ourselves.
Have a wonderful Sunday evening.
You're probably referring to the Chernow book. There are several other major biographies that...
...have reassessed Grant's Presidency.
Most of them don't go as far as I do, since I regard him as the second most important and second greatest President of the 19th century.
I personally believe that if Lincoln had not been assassinated, the common assessment of him as the greatest President of the United States ever would not be nearly as consistent as it is.
Lincoln would have had to address the same issues that Grant did, a bitter and fragile peace, and actually until he was killed, he did not actually have the same contemporary prestige that Grant had. Grant was a sphinx; Lincoln wasn't, at least to their contemporaries.
In saying this, I am not maligning Lincoln; I actually believe that he deserves the common ranking as #1, but I insist that Grant - who saw himself as working to fulfill Lincoln's legacy and died in view of Lincoln's portrait - is nearly an equivalent.
The "intermediate" ranking to which Grant has now risen in historian polls still disgusts me. No one appreciates the magnitude of the task, just as few people appreciate the magnitude of his Overland military campaign, which finalized a horrid war.
Grant was simply the reification of what made America a great nation, and in the late 1870's - after his Presidency - everyone on the planet pretty much knew it, as is evidenced by the World Tour he took.
OK. Everyone should do what they can; clearly you are; but I hope...
...you will understand my frustration at weak efforts in a clearly rising disaster of global proportions.
I do come across as hostile, I'm sure, but frankly, it's just generalized anger because of what I have come to know, and I hope you will understand that it's because of what I've come to understand, and not directed at you personally.
Clearly you care..
If you focus your attention on weak means of addressing this crisis, you are still doing far more than most Americans, especially in the age of Trumpism, and for this you clearly deserve some admiration and respect.
It's not as if I have a realistic approach, in the political or sociological sense, to solving this problem. I'm like a man with small cell lung cancer who's reading about treatments that might be available some day even though he has been declared terminal.
I will confess that 30 years ago, when I first started seriously thinking about issues in the environment by delving into the primary scientific literature, I went through a phase where I actually believed that the world would be wonderful if everyone had an electric car and a solar cell system on their roofs.
Been there. Done that.
It's clear that depending on how one searches the literature, one can still find evidence to believe this, although frankly, the case is less and less defensible.
I recall George H.W. Bush announcing that the "American lifestyle is not negotiable," as if one could negotiate with the atmosphere.
We can't.
(Despite attempts to rehabilitate them, the Bushes are really awful people, considerably worse than even the awful Kennedys)
We're really at a "finger in the dike" moment at, say, the Banqiao dam disaster, which killed according to most sources around 170,000 people, although there are a number of estimates that are considerably higher. (The true death toll will never be known.)
Fukushima!!!?!!
I had a vague feeling that I'd recently come across a "well to wheel" paper, and as kind of a peace offering for my angry tone, here it is:
Current and Future United States Light-Duty Vehicle Pathways: Cradle-to-Grave Lifecycle Greenhouse Gas Emissions and Economic Assessment (Elgowainy et al Environ. Sci. Technol., 2018, 52 (4), pp 2392–2399.)
I opened the PDF in my files, and looked at it, and it has all this wonderful stuff about if we lived in the solar nirvana and had electric cars, our GHG would be such and such...etc...etc...etc.
(I've been hearing this stuff for so long and with such deepening frustration at how delusional it is, that for me it's pure "Waiting for Godot," but no matter...)
I'm not going to have time today to really go deeply into this paper, open the HTML in a library, put up all the high resolution graphics, and superficially discuss the text as I do here from time to time on other topics. (My sons have both come home from college this weekend and we need to do some business and logistic things. There is a prosaic life beyond these vast issues, "deck chairs on the Titanic" as they sometimes say...)
Maybe I will someday have time. Watch this space if interested in what I have to say on this topic, or feel free to ignore it.
But here is the low resolution graphic that pretty much describes what the thinking of the NREL and other National Lab type people think about the non-negotiable American lifestyle and transport vehicles:

With a quick glance, one can see that if electric cars have some Greenhouse Gas advantages over gasoline based ICEV cars, there are clearly a large number of them, depending on the source of electricity, that are very much in the same range as gasoline cars.
To me this suggests that the enthusiasm for the electric car enterprise as "doing something" - the wild enthusiasm for and worship of that awful fool Elon Musk and his stupid car for billionaires and millionaires - is nearly the equivalent of doing nothing at all.
(Note that the graphic above only refers to vehicles that contain some electrical components, and not to the average gasoline type car that still characterizes the "non-negotiable" American lifestyle, the exception being the ethanol cars for which Jimmy Carter had so much enthusiasm almost half a century ago, this at the ultimate cost of the destruction of large tracts of the Mississippi Delta ecosystem.)
Thanks for your comments. I actually appreciate them.
Another "By such and such a year" statement, this time from the EU ministers.
European Ministers called for a 35% reduction in automotive carbon dioxide emissions, which drew immediate criticism from German car makers who say it can't be done, jobs, jobs, jobs, and so on...
Auto makers criticize 35% decrease in automotive CO2 emissions "by 2030" target.
It's impossible they say.
I don't know why they even bother complaining. Of course it won't happen. None of these "by such and such" statements are worth the carbon dioxide generated to broadcast them.
Despite the widely applauded and delusional celebration of the "rise of solar and wind energy," the world has now hit an annual average increase of 2.2 ppm per year.
The only thing that will happen "by 2030," is that CO2 emissions, even if they don't rise to 2.5 ppm (or more) per year, will exceed this years peak value, approximately 411 ppm, by reaching figures of roughly 438 ppm, if not more.
There will be more weather disasters, of course, and perhaps some outbreaks of crop failures and famine.
But the conversation will still be about jobs, oh, and how great solar and wind will be some day.
The only thing truly "renewable" is empty promises.
Germany will have no more nuclear power, of course, because they are going to be "green" despite people protesting the cutting down their forests to be "renewable." There will be no young (or even) old trained nuclear engineers in Germany, no nuclear infrastructure, and, um, no trees, no red kites, no bats.
You know, Fukushima!
Bleak, but true.
I wish you a pleasant Friday, and a wonderful nirvana life "by 2030."
A Study of the Evolution of HBV Virus By Sequencing Samples Up To 4000 Years Old.
The paper I will discuss in this post is this one: Ancient hepatitis B viruses from the Bronze Age to the Medieval period. (Eske Willerslev et al.Nature Volume 557, pages 418–423 (2018))
Recently I've become interested in the biophysical chemistry of nucleic acids, developing a somewhat amateurish understanding of the topic that despite being primitive is nonetheless awe inspiring. The development of modern sequencing techniques, stimulated by a Government investment - the human genome project set in motion by the Clinton administration - that ultimately stimulating great success in the private sector, has resulted in incredible scientific advances in this age of rising popular ignorance. It's probably as stimulating for biology, biochemistry, and medicine as the Government investment in the more popularly dramatic landings on the moon -set in motion by the Kennedy administration in response to developments in the Truman/Eisenhower era - were to the computer industry.
A terrifying aside:
The days of great government stimulated science are ending since primitive troglodytes - the result of a highly effective Russian attack on the United States applauded by people who nonetheless obscenely wrap themselves in American flags, claim moral superiority while kidnapping children and glorifying rape: George Orwell's "doublespeak" brought depressingly to life - have ended up controlling the government. Future generations will justifiably curse us for allowing this to pass.
They uniformly hate everything that's beautiful, a hatred of science being only one aspect.
Anyway. Enough. There still is beauty to be seen, and perhaps it will rise again. Anyway.
This interest in nucleic acids drew my attention to the paper cited at the outset of this post. It appears that scientists have sequenced the viral genome from samples thousands of years old.
From the introductory text:
...Approximately 257 million people are chronically infected and around 887,000 people died in 2015 owing to associated complications...
...Despite the prevalence and public health impact of HBV, its origin and evolution remain unclear6,7. Inference of HBV nucleotide substitution rates is complicated by the fact that the virus genome consists of four overlapping open reading frames8, and that mutation rates differ between phases of chronic infection9. Studies based on heterochronous sequences, sampled over a relatively short time period, find higher substitution rates, whereas rates estimated using external calibrations tend to be lower, leading to a wide range of estimated HBV substitution rates (7.72?×?10^?4–3.7?×?10^?6 substitutions per site per year)10,11,12...
The authors report that the virus exhibits 9 subtypes, and that efforts to attribute the distribution of these subtypes by tracing, for example, human migration give ambiguous results, as does the study of the viral sequences that infect other species affected by HBV, including other primates and animals like squirrels and bats.
Here's a figure from the text showing the distribution of some HPV subtypes:

The caption:
To get a better understanding of the history of this virus and the disease it causes, they do a remarkable thing as implied by the comment "b" in the caption: They examine viruses obtained from tissue samples that are hundreds and even thousands of years old.
A remark from the text:
Recombination is known to occur in HBV24. We found strong evidence that an ancient sequence (HBV-DA51) and an unknown parent recombined to form the ancient genotype A sequences. Although this cannot literally be the case owing to sample ages, the logical interpretation is that an ancestor of HBV-DA51 was involved in the recombination. The same recombination is also suggested for the two modern genotype A sequences that were included in the analysis. The ancient genotype B (HBV-DA45), a modern genotype B and two modern genotype C sequences were not similarly flagged, which suggests that the possible recombination occurred after genotypes A, B and C had diverged.
Recombination is a type of genetic modification which is known to take place naturally in a wide range of living things; however when this process is the result of human engineering, it generates a huge amount of protest from people like those benighted people who join organizations like Greenpeace; while it may be true that all Republican members of the House, Senate, and the current administration are anti-science troglodytes, it is not true that all anti-science troglodytes are Republican government office holders and their supporters.
The authors construct a putative evolutionary tree from there study of ancient DNA.
Here's a figure from the text:
The caption:
The authors discuss their data thus:
...Sequences HBV-DA27, HBV-DA29, HBV-DA51 and HBV-DA222 phylogenetically group with the modern genotype D. They have high sequence identity (96.99–98.74%) with modern genotype D sequences (Extended Data Table 4a), and have the typical 33-nucleotide deletion in the preS1 region of the S gene, encoding the three HBV surface proteins8 (Table 2).
Sequences HBV-RISE154, HBV-RISE254 and HBV-RISE563 are in a sister relationship with the chimpanzee–gorilla HBV clade (Fig. 2). HBV-RISE254 and HBV-RISE563 have the same 33-nucleotide deletion in the preS1 sequence that is shared with non-human primate HBVs and human genotype D (Table 2). HBV-RISE563 does not encode a functional pre-core peptide (Table 2). On the basis of sequence similarity across the whole genome, HBV-RISE563 and HBV-RISE254 together might be classified as a new human HBV genotype that is extinct today, and HBV-RISE154 might possibly be classified as another
The authors have a very interesting discussion of the geography of their samples and the sequences found and identified in those regions, Central Asia, Hungary, Kazakhstan, India...etc etc.
The beauty of science is that unlike the increasingly common assertions of orthodoxy and dogma - no one should be so smug as to assume immunity - science can and does question itself; science is a process of questioning what one knows or thinks one knows.
Some closing text along these lines:
Scientists can use the words "probably misleading," whereas our political figures define what is deliberately misleading and now more obviously outright lies, as "truth," truth being in their case, again, in the Orwellian sense.
It's an interesting article, quite awe inspiring, and yet depressing in the sense that we face great risks if we do not stop these awful people occupying our government.
I despite these threats to our way of life and to our hope for progress, you are having a wonderful week.
Characterizing the Materials Composition and Recovery Potential from Waste Mobile Phones
The paper from the primary scientific literature that I will discuss today, is represented, in part, by the title of this post. The full title is:
Characterizing the Materials Composition and Recovery Potential from Waste Mobile Phones: A Comparative Evaluation of Cellular and Smart Phones (Singh et al ACS Sustainable Chem. Eng., 2018, 6 (10), pp 13016–13024.
Recently I drove up to my son's university - which is not far - to bring him the replacement cell phone his mother bought him in case the one he had finally failed; he jumped in a swimming pool with it just weeks after his brother jumped in the ocean with his. We were able to actually get the swimming pool version to work, by putting it under high vacuum after soaking it in deionized water. The same procedure did not work for the ocean water exposed cell phone.
The technicians at the store cheerfully switched the phones over.
Since I have an acute awareness of what's in their phone - I often get myself in a "peak oil tizzy" over indium, even if "peak oilism" has entirely lost credibility because it didn't happen fast enough to make sense in our party hearty and screw tomorrow world. (I personally can't wait for "peak oil," since I'm not so concerned that the oil will run out but that the place to dump oil waste - the planetary atmosphere and hydrosphere - has run out of space to safely contain it.
I asked the technician who was working on my phone if he could "recycle it" and he just laughed, since, he said he has no idea how to do that, and when he has a customer who insists he try, he usually ends up putting the phone in the trash.
Recycling is energy intensive, and depending on how its done, can have huge environmental, health and moral problems. Toxicology literature examining China is rife with these consequences.
However, with vast quantities of cheap, clean energy I believe it's possible and desirable.
The paper cited at the beginning here does a wonderful job telling us what's in cell phones.
First it's always good to begin with scale; too often our lies to ourselves begin with representing some lab scale thing as if it were an industrial solution. The scale of cell phones, according to the part I've put in bold from the introductory text is mind boggling.
A mobile phone is a portable hand-held device that can make and receive calls over a radio frequency link within a telephone service area. A mobile phone that contains a fixed set of functions such as voice calling, text messaging, and web browsing is generally referred to as a feature or cellular phone; a mobile phone that contains a number of distinguishing features and offers greatly advanced computing capabilities is referred to as a smart phone.(5) The volume of waste mobile phones is growing rapidly all over the world, while the collection and recycling rates of these waste devices are insignificant compared to other waste electrical appliances.(3,6?8) Waste mobile phones typically consist of many materials such as plastic, printed circuit boards (PCBs, which contain most of the precious and toxic metals), screens, magnets, vibrators, LED back lights, steel, and batteries, with a complex chemical composition.(9) In the past few years, various researchers and research institutions have published numerous research studies, white papers, and reports on the metal composition of mobile phones.(6,10?14) However, no comprehensive evaluation of the precise components of these devices, nor any comparative study of the various models of cellular and smart phones and their metal compositions, is readily available.
The authors note that a lot of precious materials go into making these devices, reporting data indicating that the world's electronics industry consumes more than 850 metric tons of gold, 6500 tons of silver and almost 30 tons of palladium annually.
Gold mining, in particular, is a very noxious business: think mercury, or cyanide or both.
Anyway, the authors provide us with a wonderful graphic showing where the stuff in portable phones are located:

Not all of these materials are found in "green" solar cells, by the way, but many are, which is why - speaking only for myself - I have a jaundiced view of the words "green" and "renewable" attached to solar cells. They require far more mass than cell phones and for that matter computers, meaning that their scale will dwarf the already intractable electronic waste scale.
By the way PCB here does not refer to the highly toxic polychlorinated biphenyls, but rather to "printed circuit boards" (Many electronic devices do contain PBDE's - polybrominated diphenylethers - as flame retardants. Measurements have been made showing huge concentrations of this stuff in Chinese children; China's banning imported "green" electronic components to be recycled.
This graphic, similar to the first, adds metal content to the components.

The caption:
The grind the cell phones up to analyze them:

Here's where he finds the metals are:

The caption:
The mass of precious metals in cell phones.

The caption:
Figure 5. Precious metal content in waste cellular and smart phones’ PCBs, manufactured between 2001 and 2015. (a) Precious metal content in waste cell phones. (b) Precious metal content in waste smart phones.
While these gold mg/phone concentrations seem low, keep in mind that ores from which gold is mine - again using very dirty processes - are also at a similar level of concentration.
The authors comment:
The demand for precious metals such as gold, silver, and palladium has been increasing rapidly with the increasing consumption in the electronics industry around the world. Figure 6(a) and (b) show the precious metal consumption trends in waste cellular and smart phones from 2001 to 2015. These results reveal that the consumption of precious metals has been constantly increasing in smart phones, while in cellular phones the contents of gold and palladium have remained almost unchanged while the silver content has shown a rapidly increasing trend. The average price trends of the precious metals from 2000 to 2017 are shown in Figure 6(c) (data attached in Supporting Information Table S2). This figure shows that the prices of all the precious metals are increasing, although gold and silver reached their peaks in 2012 and then resumed normal trends in 2013, possibly because of the global economic recession or the gold mining restrictions in some countries. Nevertheless, overall price trends are increasing along with the increasing demand for precious metals in metal-consuming industries. For example, approximately 861 tonnes of gold, 6619 tonnes of silver, and 29 tonnes of palladium are being consumed by the electronic industries annually.(18) However, these amounts of precious metals represent only 10 to 15% of total global production, while the recovery rate for these precious metals from all end-of-life electronic devices is less than 10%, and in the case of mobile phones, it is around 2 to 5%, and sometimes even less. Most of the precious metals in waste mobile phones are still encased somewhere in individual households or storage yards
They produce another graphic relevant to their discussion:
The caption:
The authors conclude in part:
It is high time for waste mobile phones to get proper attention from government and the public, to increase awareness about their recycling value and the hazardous toxins they create when improperly managed. Not only are there serious environmental and human health effects from improper management waste mobile phones, but recycling the phones also has real economic value.(48,49)
What they say here probably goes for other electronic waste, but note it is more expensive, and energy intensive, to do this safely as opposed to declaring ourselves "green" because "we" "recycle" without regard to the conditions and health of the impoverished people who make us "green."
I have to go.
Have a pleasant work week.
Nature Communications: "Europe's 'Renewable Energy' Policy Likely to Destroy It's Forests."
In 1307, Edward I banned the combustion of coal in England, thus enacting the first known air pollution law in history. By the 16th century it was necessary to repeal the law because England had basically run out of wood to burn: Attitudes and Responses Towards Air Pollution in Medieval England (Brimblecomb, Journal of the Air Pollution Control Association, 26:10, 941-945)
As they say, "Plus ça change…" or "Those who forget history..."
The current article is in the scientific journal Nature Communications.
Europe’s renewable energy directive poised to harm global forests (Searchinger et al. Nature Communications Volume 9, Article number: 3741 (2018))
In January of this year, even as the Parliament of the European Union admirably voted to double Europe’s 2015 renewable energy levels by 2030, it also voted to allow countries, power plants and factories to claim that cutting down trees just to burn them for energy fully qualifies as low-carbon, renewable energy. It did so against the written advice of almost 800 scientists that this policy would accelerate climate change1. This Renewable Energy Directive (RED) is now finalized...
...Over the last decade, however, due to similar flaws in the 2008 RED, Europe has expanded its use of wood harvested to burn directly for energy, much from U.S. and Canadian forests in the form of wood pellets. Contrary to repeated claims, almost 90% of these wood pellets come from the main stems of trees, mostly of pulpwood quality, or from sawdust otherwise used for wood products5.
Greenhouse gas effects of burning wood
Unlike wood wastes, harvesting additional wood just for burning is likely to increase carbon in the atmosphere for decades to centuries6,7,8,9,10,11,12,13,14,15,16. This effect results from the fact that wood is a carbon-based fuel whose harvest and use are inefficient from a greenhouse gas (GHG) perspective. Typically, around one third or more of each harvested tree is contained in roots and small branches that are properly left in the forest to protect soils but that decompose and release carbon. Wood that reaches a power plant can displace fossil emissions but per kWh of electricity typically emits 1.5x the CO2 of coal and 3x the CO2 of natural gas because of wood’s carbon bonds, water content (Table 2.2 of ref. 17) and lower burning temperature (and pelletizing wood provides no net advantages)
The full paper is open sourced and you can read it yourself if you care to do so.
Here's another link to the subject from Princeton University: Europe’s policy to treat wood as low-carbon fuel poised to harm global forests
Don't worry, be happy. Split wood, not atoms! Go green, or um, ash and mud colored anyway...
In case you thought that the United States was the only insane place in the world, I thought I'd offer this.
Have a happy Sunday tomorrow.
Plant functional trait change across a warming tundra biome.
The paper from the primary scientific literature I will discuss briefly in this post is this one: Plant functional trait change across a warming tundra biome. (Anne D. Bjorkman et al Nature Volume 562, pages 57–62 (2018).
An excerpt from the introduction:
The "et al" in the author list here is rather large; this is the work of a large team of scientists, as the work demanded:
That's cool, scientists wandering across the tundra all over the world to make 56,000 measurements.
The paper is rather long, as one might expect, and regrettably it seems not to be open sourced. Someone who wishes to read it must either travel to a library or else take advantage of Nature's current quite reasonable (and wonderful) reduced price subscription offer which can be located on the internet. Here's some pictures from the paper, though:
The caption:
The caption, where "IVT" is intraspecific variation; "CWM" is community-weighted trait means ;"LDMC" leaf dry matter content:
More graphical data:
The caption:

The caption:
Some remarks on plant height:

The caption:
The authors describe possible positive and negative feedbacks associated with our inability to address the rising tragedy of fossil fuels:
We need to understand this stuff, but we are in no place to change what it happening, particularly with the international will to celebrate ignorance, racism, rape and ethical vapidity, which prevents us from doing what might have been done. With no reference to my screen name, we are at the nadir, or at least one hopes so.
Nature - and here I'm not referring to the journal but to reality - is affected by politics, of course, but it will do what it will do independent of politics. Politicians can destroy the world by denial, inaction, or lies - and our contempt for the future suggests this is a real possibility - but they can not pass laws to demand that rain or snow fall, or that winds blow or don't blow, or food grows or doesn't grow.
It is easy to criticize our current Congress and it's now publicly and openly stated fondness for rape and for lies - as well as the administration's hatred of children and in fact, all future generations - but frankly, as an advocate of nuclear energy which I regard as the only technology that might work to address climate change - nuclear energy is often demonized by what I regard as "ersatz environmentalists" who complain it's not perfect (and it isn't) as if anything was - in my opinion we on the left are not innocent in the creation of the situation in the Tundra and elsewhere around the world, in every space the atmosphere touches.
"We" seem to think the solution is involved with Elon Musk's stupid electric car for billionaires and millionaires and other consumer junk like that, "all new stuff."
It isn't.
I hope you will have a pleasant and rewarding weekend.
The degrees of freedom are zero at this point.
While power point presentations have, well, power, the days of the professor with chalk and a blackboard had their own magnificence.
For fun, go back to the beginning. A fun basic lecture.
Profile Information
Gender: MaleCurrent location: New Jersey
Member since: 2002
Number of posts: 33,512