NNadir
NNadir's JournalHighly ordered MAX Phases of the Lanthanide Elements
The paper I'll discuss in this post is this one: Atomically Layered and Ordered Rare-Earth i-MAX Phases: A New Class of Magnetic Quaternary Compounds (Quanzheng Tao, et al, Chem. Mater., 2019, 31 (7), pp 2476–2485. The paper is an international collaboration with scientists in the Sweden, the United States, Germany, Israel and France.
Happily for me, my son will be interning at one of these labs this summer. (I sent him the paper, but he has finals coming up and will need to read it later.)
The MAX phases are machinable ceramics with interesting properties, among the most interesting, to me at least, is resistance to chemical attack, high thermal resistance, and in some cases, considerable resistance to amorphization in neutron fluxes. These materials were originally discovered by Nowotny in 1980. The most well known of these compounds is Ti3SiC2.
Here from the internet is a picture of the structure of these highly ordered layered compounds:
From the discussion in the text of the paper under discussion:
One of the authors of this paper is Michel Barsoum, who has been the main driver of research into these remarkable compounds.
He has written a monograph on these remarkable materials. It is here: MAX Phases: Properties of Machinable Ternary Carbides and Nitrides
I expect that these compounds will play a huge role in technology in the case where humanity is able to recover from climate change and other consequences of vast popular stupidity.
Personally I am only familiar with MAX phases of the 8 first elements, and of those, have been mostly interested in those of the earth abundant elements Ti and Zr. However I often wondered about whether they could be made with lanthanides and actinides. Now they have been made with the former.
This paper is about magnetic properties, mostly at very cold temperatures and not so much about mechanical or thermal properties, which are of more interest to me. Nevertheless, this discovery is wonderful and I hope to read more about these new lanthanide "i-MAX" materials in the future.
From the paper's introduction:
Recently, we discovered quaternary (M1 2/3,M2 1/3)2AC phases that we coined i-MAX because the M elements are in-plane ordered. The M1 atoms sit on a honeycomb lattice, and the M2 atoms sit on a triangular lattice. The A layers form Kagomé-like patterns. This discovery has greatly expanded the number of M elements and their combinations that can be incorporated in the MAX phases. Examples include (Mo2/3Sc1/3)2AlC, (Mo2/3Y1/3)2AlC, (V2/3Zr1/3)2AlC,16,17 and (W2/3Sc1/3)2AlC.18 ...
...Herein, we report the synthesis of 11 new i-MAX phases with the general formula (M1 2/3,M2 1/3)2AlC, where M1 is Mo and M2 is a RE element, namely, Ce, Pr, Nd, Sm, Gd, Tb, Dy, Ho, Er, Tm, and Lu. In all cases, the resulting structure is layered with chain-like arrangement of the RE element (Figure 1a). When the metal layers are imaged from the top, it is clear that the RE atoms (depicted in cyan in Figure 1b) form a 2D triangular lattice. The here demonstrated frustrated quasi-2D sheets of RE elements are expected to lead to complex magnetic properties via intra- and interplane exchanges caused by the well-known Ruderman?Kittel?Kasuya?Yosida indirect coupling mechanism of localized inner 4f-shell electron spins through the conduction electrons.
For now, let's just look at the beautiful pictures from the paper:

The caption:

The caption:

The caption:
The caption:


The caption:

The caption:

The caption:
Some cool experimental details:
Cool stuff overall.
Have a nice day tomorrow.
New Weekly Record High for Carbon Dioxide Established at Mauna Loa.
I'm not sure we've reached the maximum of the yearly cycle for carbon dioxide concentrations at Mauna Loa, which last year was obtained on the week ending April 22, 2018 and recorded at 411.68 ppm. In previous years this peak was often reached in May, but who's counting.
From the Mauna Loa Carbon Dioxide Observatory:
Up-to-date weekly average CO2 at Mauna Loa
Week beginning on April 21, 2019: 413.77 ppm
Weekly value from 1 year ago: 411.70 ppm
Weekly value from 10 years ago: 389.94 ppm
Last updated: April 28, 2019
The increase over 1 year ago is 2.07 ppm, compared to the average of weekly year to year increase readings over the last 4 weeks, which was 2.85 ppm over the weekly reading of 2018.
The value recorded here, 413.77 ppm, is the highest weekly average reading ever reported at the Mauna Loa Observatory.
If the fact that this reading is 23.83 ppm higher than it was ten years ago bothers you, don't worry, be happy. I read right here on the E&E pages that solar power installations in American cities have doubled in the last six years, increasing in energy output from next to nothing to slightly farther to nothing.
My impression that I've been hearing all about how rapidly solar energy has been growing since I began writing here in 2002, when the reading on April 21, 2002 was 375.42 ppm should not disturb you, since it is better to think everything is fine rather than focus on reality.
At the risk of repetitively asserting that reality - as opposed to cheering for our own wishful thinking - matters, let me say again.
In this century, the solar, wind, geothermal, and tidal energy on which people so cheerfully have bet the entire planetary atmosphere, stealing the future from all future generations, grew by 8.12 exajoules to 10.63 exajoules. World energy demand in 2017 was 584.98 exajoules. Unquestionably it will be higher in 2019.
10.63 exajoules is under 2% of the world energy demand.
2018 Edition of the World Energy Outlook Table 1.1 Page 38 (I have converted MTOE in the original table to the SI unit exajoules in this text.)
According to this report, the fastest growing source of energy on the planet in the 21st century over all was coal, which grew from 2000 to 2017 by 60.25 exajoules to 157.01 exajoules.
If you think that unlike you, I am worrying and not being happy, you can always chant stuff about how "by 2050" or "by 2075" or "by 2100" we'll all live in a so called "renewable energy" nirvana powered by the sun and tooling around in Tesla electric cars.
I'll be dead "by 2050," as will most of the people doing such soothsaying about that magic year, but I'm sure that the future generation living through 2050 will all be cheering for our perspicaciousness.
Or maybe not.
Maybe they'll hate our guts for not being remotely realistic, for leaving them with so little and so much destroyed.
Who can say? Soothsayers?
I may be too jaded to be comforted by "by 2050" rhetoric, having heard this stuff my whole adult life - and I'm not young - but you could try.
It's not results that count, but good intentions.
I hope you're having a pleasant Sunday afternoon.
A Detailed Thermodynamic Accounting of a Route to Obtaining World Motor Fuels from Solar and Wind.
(Edited 2/9/22 to restore graphic links. Since the original version of this post was completed, the two papers listed immediately below have been corrected.)
The main papers I'll discuss, among others, in this post are these:
Production of Oxymethylene Dimethyl Ethers from Hydrogen and Carbon Dioxide—Part I: Modeling and Analysis for OME1 (Mitsos et al, Ind. Eng. Chem. Res., 2019, 58 (12), pp 4881–4889)
Production of Oxymethylene Dimethyl Ethers from Hydrogen and Carbon Dioxide—Part II: Modeling and Analysis for OME3–5 (Mitsos et al, Ind. Eng. Chem. Res., 2019, 58 (14), pp 5567–5578)
Here is a swell graphic from the introduction of one of these papers:
It's, um, a cartoon.
The storage of energy, in general, wastes energy, and the amount of energy wasted by batteries, for example, is quantifiable in terms of particular technologies. This irrefutable fact is connected with the second law of thermodynamics, a law which cannot be repealed either by a tin-horn dictator, a legislature, a prime minister, president, by anyone. It is a law of physics and not social or political "science."
This was the topic - how much different types of batteries waste - I covered in this space in my most recent post: The External Cost, Including Climate Cost, of Stationary Batteries For Grid and Off Grid Power.
Probably that post was too "sciency" - as this one will be - and hardly as sexy as a post based on a university press release announcing a "breakthrough" involving some pop fantasy about electric cars, windmills and solar cells, said fantasies having done nothing at all, after half a century of delusional cheering, to arrest the growth in the use of dangerous fossil fuels or the growth in environmental destruction caused by them, most notably, climate change.
In general, I am a wild-eyed critic - a sort of screaming and chanting wild-eyed prophet in a desert - of the car CULTure, but to demonstrate an important caveat about the waste connected with storing energy, I will use the popular "car think" that is familiar to most people, and consider the difference between a hybrid car fueled by dangerous fossil fuels and an fully electric car.
Both types of cars contain large capacity batteries, but the difference between them is connected to the type of electrical energy they store:
A hybrid car of course requires gasoline to run, and with the exception of a few plug in versions like the discontinued Chevy Volt, the electricity stored in the battery is generated by the use, as primary energy, gasoline. Of course, almost all of the cars on the planet still use gasoline, so this makes them different than electric cars. But the energy used to charge the battery in a hybrid car is already waste energy, specifically the energy lost to braking - in a pure gasoline car this energy is wasted as heat generated in the brakes - the energy wasted when the car is stuck in traffic, or idling at a traffic light, and the energy wasted by car's generator which is necessarily in excess to accommodate all permutations of cabin use of electricity for heating & air conditioning, entertainment systems, navigation systems and communication systems such as cell phones and internal automotive "hot spots." (One must love our bourgeois culture, it's so, um, um, um, holy?.) Therefore automotive generators are required to produce more electricity than the average demand, and are in fact designed to meet a putative maximum demand. Any electricity generated by an automotive generator beyond the demand at any particular point is already waste energy, and thus if it is used to charge a battery that is not at capacity it is converted from waste to recovered energy.
The energy conversions involved in a hybrid car are these: Chemical energy is converted to mechanical energy and electrical energy, and mechanical energy and electrical energy are converted back to chemical energy (the battery.) Some of the mechanical energy is recovered in braking, some in idling.
Now let's consider an electric car:
Most people sitting in praise of electric cars like to pretend that all of the energy coming out of their wall socket comes from solar and wind energy. Some people even pay extra money to assure that this is true and get these nice little paper "certifications" of this purported "fact." However, the real fact, is that there are no clerks how sort electrons directed to a particular house. Anyone who believes that this payment has any meaning merely needs to consider if his or her lights, air conditioners, television sets and computers go off on a hot summer night when the wind isn't blowing.
In fact, so called "renewable energy" is a trivial form of energy. Between 2016 and 2017, worldwide energy demand grew by 8.88 exajoules to 584.98 exajoules whereas all the solar, wind, geothermal and tidal crap combined increased it's output by 1.21 exajoules to 10.63 exajoules total. The fastest growing source of energy on this planet was dangerous natural gas, which grew in that one year period by 4.19 exajoules, in the mindless "percent" talk one hears when energy is discussed by partisans of the failed so called "renewable energy" scheme, by 344% faster than so called "renewable energy." Petroleum use rose by 1.97 exajoules in that period, making it the second fastest growing source of energy.
In the United States, an oil and gas drilling hellhole, the proportion of electricity produced by dangerous fossil fuels is growing rapidly, as spectacularly safe nuclear energy is displaced by spectacularly unsafe natural gas, accompanied by absolutely mindless cheering from people who no interest in and no knowledge of science and absolute contempt for the future of humanity.
So when I consider the electric car I will be reality based, even if 40% of the electricity in my state (down from 50%) comes from clean nuclear energy, and remain close to reality in this country as a whole, and practically every other country on this planet, and consider that almost all of the electricity comes from dangerous fossil fuels.
To propel an electric car, chemical energy, in the form of dangerous fossil fuels, is converted to thermal energy, the thermal energy is converted to electrical energy (in the generator), the electrical energy is shipped with some, albeit small, loses to thermal energy, then converted to chemical energy (the battery), than reconverted to electrical energy, and then converted to mechanical energy, (the electric motor). If the electricity is generated by a combined cycle dangerous natural gas plant, the thermal efficiency of the first step is roughly 50%, the electricity delivered at the outlet due to transmission losses is 97%-99% of the generated electricity (depending on distance), depending on the battery type, the charging efficiency is shown by this graphic from my previous post, in which the purple portions of the bar graphs in the LCE headings more or less follow the thermodynamic efficiency of batteries including the cost of generating the electricity:
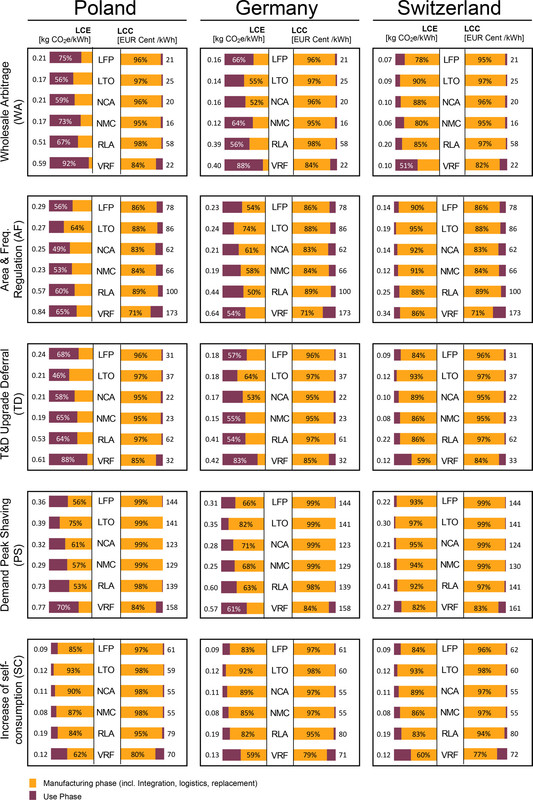
The caption:
(Note that most of the electricity in Switzerland is either generated by nuclear energy (about the same proportion as New Jersey) or hydroelectricity, at least until the glaciers are gone. Switzerland's citizens have voted to phase out nuclear energy. Goodbye glaciers.)
The important point is that with the exception of the mechanical energy converted to chemical energy by braking, none of the energy for charging an electric car is inherently waste energy. All of it comes from primary energy which is converted at huge thermodynamic penalties into mechanical energy.
Since the overwhelming majority of the world's electricity is generated by dangerous fossil fuels, this waste connected with pure electric cars shows up in the planetary atmosphere as carbon dioxide, nitrogen oxides, sulfur oxides, volatile mercury, volatile lead, benzofurans, benzodioxins, PAHs etc, etc, etc.
A hybrid car is not a "green" or "clean" machine, but in many cases, if not New Jersey where I live partially powered by nuclear energy, an electric car is potentially more noxious than a hybrid car, even considering the fact that it's drive train, if not its comfort systems, are not wasting energy at traffic lights or in heavy traffic. This fact is regularly discussed in the primary scientific literature.
But this post is not supposed to be about cars, which, with acknowledged hypocrisy, I drive, but which I nonetheless detest.
It is about chemical fuels that can be produced from waste carbon dioxide using so called “renewable energy.”
This brings me to the paper discussed at the outset.
From my perspective, the most valuable chemical fuel to displace all the world's demand for gasoline, LPG, diesel fuel, dangerous natural gas, and, paradoxically, many refrigerants, is dimethyl ether.
Here is the marketing web page of the International Dimethyl Ether Association listing some of the benefits of this fuel:
International DME Association.
Very often good ideas lack the strength of bad ideas, which is why we are where we are on this planet, but no matter. The technical superiority of DME to all other chemical fuel options is clear enough, but the fact is that DME, like the much ballyhooed hydrogen from which it may be made, is not primary energy. It is stored energy.
It is fashionable, even among scientists, to claim that the goal of almost every effort to make liquid fuels will be a path for storing so called "renewable energy." Probably this is a good way to get grants, given the popular if delusional mentality with which energy is almost always discussed.
However, if one merely looks at reality, rather than continuously reading or pronouncing conditional statements including featuring the word "could," or making rather absurd statements like this one, from the introduction to Part I of the two papers under discussion...
...belief in the viability is ridiculous because we are more than half a century of constant yelping and cheering about so called "renewable energy" and, as of 2017 the combined solar, wind, geothermal and tidal energy schemes were producing 10.63 exajoules out of 584.98 exajoules being generated and consumed by humanity.
The "could" above has been put in bold by me, obviously. I have been hearing the word "could" in connection with so called "renewable energy" so long, I am compelled to wonder why there is never any is.
In another context entirely Abraham Lincoln remarked that...
So called "renewable energy" has not proved it can produce significant electricity, never mind make enough electricity to make stored liquid fuels. The problem is that there is very little renewable energy on this planet, so little that any effort to store it, at a thermodynamic loss no less, would be self defeating, making it even more useless than it already is, and it is useless.
However the good part about all this nonsense is this. Much of what is written with de rigueur genuflections to so called "renewable energy" is actually applicable for energy that is actually sustainable and scalable, nuclear energy. That is certainly the case for these two papers which, after the nonsense statements about so called renewable energy are completed, turns to a very practical consideration, the conversion of the dangerous fossil fuel waste carbon dioxide into a useful product, a fuel for self propelled vehicles such as buses, delivery trucks, ambulances, tractors, etc...
The first two paragraphs of part I of the paper however do proceed with the usual wishful thinking, and include reference the thermodynamic nightmare of water electrolysis, the most environmentally and economically suspect alternative to producing hydrogen from natural gas. About 1% of the world's hydrogen is produced by electrolysis, and then only as a side product of the production of chlorine gas and caustic soda, NaOH.
Nevertheless, despite it's inherent thermodynamic penalties, it is important to note in all discussions in these papers, the authors are basing all of their comments on an assumption that the hydrogen is formed electrolytically, a thermodynamic nightmare, and further that all of the electricity in question comes from the still (and always) useless solar and wind industries.
The third paragraph is the first one worth reading, since it refers to the valuable core of the paper. It reads:
(The "n" here is a subscript in the original paper. The DU editor no longer allows for subscripts.)
The structure of methylal is this:
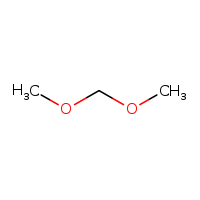
Formally this type of structure is known as an "acetal," which is made by the condensation of an aldehyde and two alcohol functions which may or may not be part of a single molecule. In this case, the aldehyde is formaldehyde, the smallest known aldehyde, and two methanol molecules. Both formaldehyde and methanol can be made by the hydrogenation of carbon dioxide, albeit under different conditions using different catalysts. (There are also electrochemical means of producing formaldehyde from carbonate, but all systems using electricity for reduction in aqueous solution have low thermodynamic efficiency.) Dioxolane is an acetal of formaldehyde and ethylene glycol and is an acetal formed from a diol, a single alcoholic molecule as opposed to two molecules:
Related to acetals are "ketals" in which the carbonyl reacting with the alcoholic functions are ketones rather than aldehyde. Here's a picture of one of my favorite ketals, "soketal" which is made from glycerol, the waste product made from the production of soap and biodiesel, by condensation with acetone:

(Soketal, unlike glycerol, has some interesting properties that suggest it's potential use as a fuel.)
In any case, the general structures of the molecules discussed in these two papers is this:

Here the "n" refers to the number of formaldehyde molecules incorporated into the short chain polymer. The first paper focuses on n = 1, the second on n = 3, 4, and 5.
The authors describe the motivation for their papers as follows:
However, most existing process chain analyses rely on literature data on the separate process steps obtained from different sources11,17,20 or are based on simplified assumptions regarding product separation.15,16,18 Furthermore, detailed analyses of bottlenecks and points for improvements of a Power-to-OMEn process chain have not been presented. This is partly due to the fact that the thermodynamics of some of the mixtures involved are very challenging to model and so far have mostly been addressed with specialized models (e.g., ref 21) that are difficult to implement in commercial flowsheet simulators. Most existing detailed simulation studies,22,23 on the other hand, only consider single process steps and not the entire process chain. Therefore, the purpose of this two-part paper is to conduct a detailed analysis of Power-to-OMEn process chains based on existing process steps to identify the potential and bottlenecks of the established concepts and to provide model implementations that can serve as a starting point for the analysis and development of new process concepts using a commercial flowsheet simulator.

(R1)
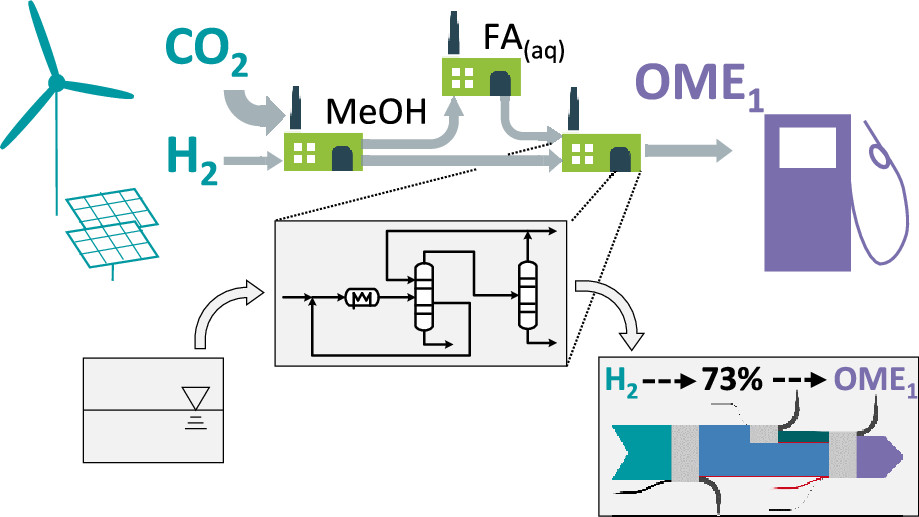
While alternative synthesis pathways such as selective direct oxidation of methanol in the gas phase27 or reaction of methanol with H2 and CO2 through homogeneous catalysis28,29 have been suggested, these are at an earlier stage of development and are hence beyond the scope of this work. We thus consider a process chain consisting of three existing process steps for converting H2 and CO2 to OME1 via methanol and aqueous formaldehyde solution (FA(aq)) as shown in Figure 1.
Figure 1:
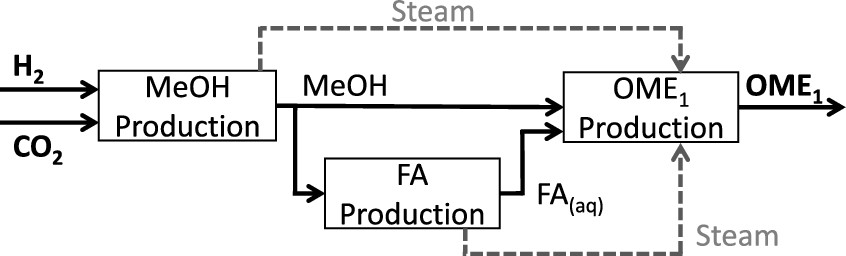
The caption:
Since the paper focuses on beginning with hydrogen and carbon dioxide it is now (thankfully) agnostic with respect to the source of primary energy; we are now free to consider thermodynamically superior and much more environmentally sustainable nuclear energy and case lose the wind and solar fantasy.
The authors give their process assumptions for methanol as a straight up hydrogenation process, shown in this diagram:
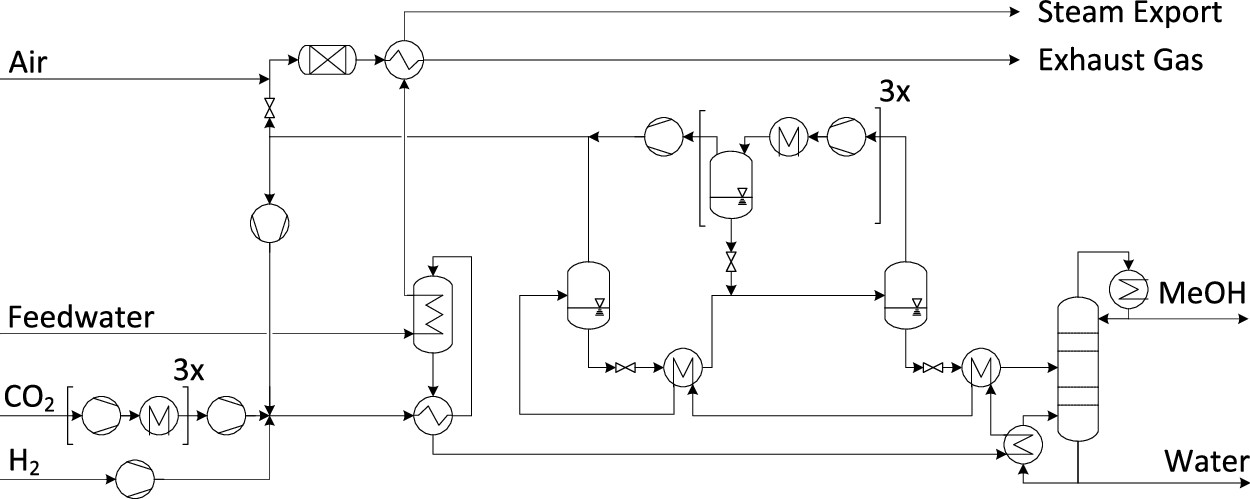
The caption:
There's no real mystery here; the scientific literature oozes with ways to make methanol from CO2 and hydrogen, although in reality, it is mostly, overwhelmingly, made by the partial oxidation of dangerous natural gas. They key to decarbonization is to make hydrogen from water and not dangerous natural gas (or worse, coal) and to make methanol (or a methanol equivalent like DME) from carbon dioxide and hydrogen and not dangerous natural gas (or worse, coal).
The authors propose to make formaldehyde by the partial oxidation of methanol.
They write:

(R2)
(R3)
Note that R2 and R3 are selected for ease of modeling (cf. section 3.2) because the actual partial oxidation reaction MeOH + O ? FA + H O 1 2 2 2 is a linear combination of R2 and R3 and is hence not needed in a conversion-based model. Main side reactions are the formation of carbon monoxide (CO) and its oxidation to CO2

(R4)

(R5)
The reactor effluent is rapidly quenched and fed to a four-stage absorption column where formaldehyde is separated from the product gas using water as a solvent to yield an aqueous formaldehyde solution of 50 wt% strength. The off-gas contains significant amounts of H2 and CO and is hence burned in order to generate 5 bar steam in addition to that generated from the reactor effluent quenching.
Hydrogenating carbon dioxide to methanol and then re-oxidizing it to formaldehyde is a thermodynamically wasteful process from where I sit. I don't actually keep up all that much on the industrial chemistry of formaldehyde production, but undoubtedly it is made from dangerous natural gas in which methanol is an intermediate using a starting material that represents primary energy. I am aware of some electrochemical reductions of carbonate (aqueous carbon dioxide) but in general electrochemical production schemes are wasteful since electricity is never primary energy. In some cases the use of electrochemistry is justified, as in the production of aluminum, titanium and other metals, since it is effectively the only continuous process route. The low solubility of carbon dioxide in water however does not suggest that electrochemistry is a good idea. Undoubtedly there are partial hydrogenations, using mildly poisoned catalysts that would work as well.
By the way, formaldehyde that one encounters in biology labs featuring dissections, or in mortuary science is not actually "formaldehyde" but is a technical aqueous solution known as "formalin." The process described here is a "formalin" process, not a formaldehyde process, since the product is a solution. Pure formaldehyde is a gas. In formalin, there is actually only small amounts of free formaldehyde, since the gas reacts with water to give a number of acetal type polymers terminating, when not cyclic, in a "hemiacetal" in which one of the oxygens is capped with a hydrogen rather than a carbon.
Here, from a paper in Scientific Reports is a nice picture of this equilibrium:
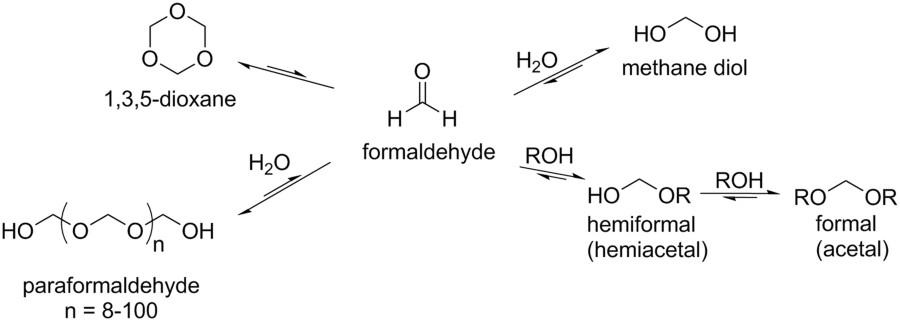
Note that the molecule above labeled 1,3,5 "dioxane" is labeled incorrectly in this diagram. It is 1,3,5 trioxane. 1,3,5 trioxane, a cyclic formaldehyde polymer, will be discussed below.
Be that all as it may, here is figure 3, on the production of formaldehyde by the re-oxidation of methanol produced from (in theory) hydrogen and carbon dioxide:
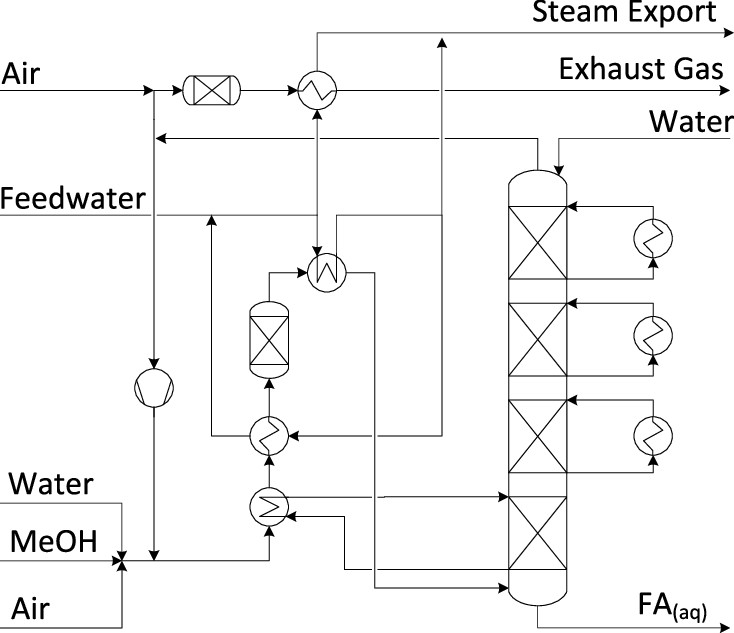
The caption:
When the formalin is combined with methanol to give methyal a difficulty arises inasmuch that methylal forms an azeotrope with methanol. An "azeotrope" is a situation wherein a mixture of two (or more) components boils at a temperature lower than the individual components themselves giving a vapor phase of a predefined composition; a famous example is ethanol and water, which distills at a temperature lower than either water or pure ethanol, giving a condensate that is 95% alcohol and 5% water, "190 proof." Solutions that form azeotropes cannot be isolated in their pure form by simple distillation, and usually one requires a chemical trick - to make "pure grain alcohol" the alcohol can, for instance, be distilled over calcium oxide (quicklime) which reacts with water to form calcium hydroxide (slaked lime) - or sometimes a physical trick with specialized multistage distillations.
Here the physical trick is to use a distillation system operating at two different pressures, a two stage distillation. Here is a diagram of the process. The following graphic shows the distillation apparatus the authors propose to break the azeotrope:
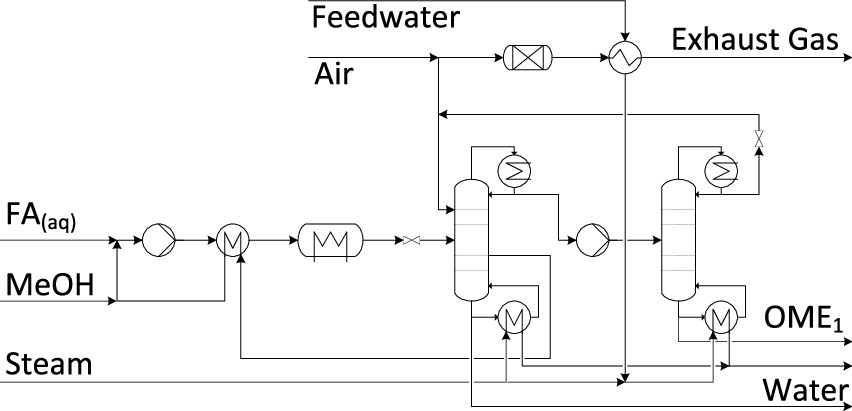
Note the energy intensive introduction of steam, a questionable approach for a system that is supposed to operate on solar and wind electricity.
Let me be clear on something: Any system that relies on diffuse and inconstant energy to drive a process of distillation of high boiling liquids will either involve huge areas - the natural system of evaporation and rain involves the entire planet - vast quantities of mass, poor thermodynamics, economic absurdity and environmental tragedy.
Distillation is a widely used technology and all commercial distillation devices must use energy at least having the energy/mass ratio of dangerous fossil fuels or electricity relying, in bulk of production, on devices depending on energy dense dangerous fossil fuels or - this is a great moral and environmental tragedy - to a lesser extent, nuclear energy. (The primary and largest use of distillation is, of course, the dangerous fossil fuel industry itself in oil refineries.) The extent to which electricity is used for this purpose represents a thermodynamically, and thus environmentally, questionably inefficient waste of energy.
All of this said, it is possible to construct systems where energy that would otherwise be waste can be used for the purpose of distillation of various commodities ranging from high boiling point materials to low boiling materials, rejecting smaller amounts of energy to the atmosphere and thus raising efficiency to very high levels, something I'll discuss near the end of this long and tiresome post. In the case of nuclear fuels, which can have temperatures internally of thousands of degrees, at least locally - the design of current nuclear reactors involves the dissipation of this heat rather than its direct use - the use of distillation can include things like liquid metals, either for the purpose of heat exchange or for purification, down to relatively low boiling commodities like methanol in an intricate network of heat exchangers.
Systems like this come under the general rubric of "process intensification," and the current issue, as of this writing, of Industrial & Engineering Chemistry Research, this one, Industrial & Engineering Chemistry Research, Volume 58, Issue 15 is a special issue devoted to just these issues.
Here, for amusement, is an equation from a paper out of UCLA entitled Process Intensification of Multipressure Reactive Distillation Networks Using Infinite Dimensional State-Space (IDEAS) (Flavio Eduardo da Cruz and Vasilios I. Manousiouthakis, Ind. Eng. Chem. Res., 2019, 58 (15), pp 5968–5983):

The point here is not to claim that I am even remotely competent to work with equations like this - I am not - but rather that there are, particularly in computational space, people who can, and who do. One can be sure in these times that there are people as well who can translate a set of equations such as these into relatively “idiot proof” commercial software that not only handles the iterations of summations, but also engages in machine learning to optimize empirical constants, such as those in sophisticated equations built on the Antoine equation. Although we are living in an age of the rising celebration of ignorance by aggressive and powerful ignoramuses, there are these islands of insight and reality still remaining in the scientific and engineering sphere much like Andre Gregory's description of Findhorn in the aesthetic and spiritual sphere. It is therefore beautiful that these scientists call their distillation network, the "Infinite Dimensional State Space" "IDEAS."
Ideas, and not ignorance, will save the world, if it can be saved.
Now, from the first paper under discussion here, some notes on the thermodynamics of this process after one has already isolated hydrogen and carbon dioxide, something that will not, with all due respect to the authors, be available from so called "renewable electricity."
where LHVi denotes the lower heating value. It differs from the first-law efficiency in that it does not account for heat or work transfer. Instead, ?CCE measures how much fuel energy can be obtained from a given amount of H2, which is the main energy source and cost driver6 and hence likely to be a limiting factor in fuel production. To account for heat and work input in a consistent manner, we also consider the exergy efficiency for the conversion of H2 and CO2 to OME1 defined as
where ṁi denotes the mass flow rate of stream i, ei denotes the specific exergy, Pel denotes the electricity consumed by the process chain, and ĖQ denotes the sum of the exergy input associated with heat demand. The ambient temperature is set to 298 K. No distinction is made between exergy destruction and exergy losses to the environment (cf., e.g., Benjan et al.67), and for representation in the Sankey diagram, the sum of both is computed as the difference between the exergy of streams entering the process step and that of useful streams leaving the process steps.
The Sankey diagram is a graphic representation of the overall thermodynamic efficiency, again ignoring the huge thermodynamic penalties of procuring the hydrogen and carbon dioxide in the first place, penalties that dominate the commercial and environmental feasibility of the entire process.

Figure 5. Sankey diagram of the benchmark process chain based on the simulation results. The width of the arrows is proportional to the exergy of the respective streams.
To the author's credit, they allude to as much:
The bold, a genuflection to the reality of so called "renewable energy" as opposed to the endless mindless hype that resulted in the atmosphere surging at an unbelievable and terrifying rate, permanently past 400 ppm of the dangerous fossil fuel waste in the planetary atmosphere in November of 2015, to the current value of 414 ppm less than four years later, is mine. The fact, despite all the self-delusion commentary to the contrary, if not Trumpian scale outright lying, is that so called "renewable energy" is indelibly welded to and dependent on access to the very dangerous fossil fuels which are killing the future.
Figure 6:
The caption:
The first sentence is pure nonsense. To beat the dying horse, we have just spent half a century and trillions of dollar proving that "renewable electricity" is decidedly not an option for climate change mitigation, since the period in which this irrational belief system has held sway, the opening decades of the 21st century, have been the opposite of "mitigation," that is they have marked an acceleration of the atmosphere's degradation. The attachment to the existing infrastructure is also questionable.
The rap on DME - my personal favorite carbon based fuel if it is prepared using nuclear energy as a primary energy source - as being unable to address this infrastructure is dubious as well. The truism that "those who say a thing cannot be done, should not interrupt those who are doing it," applies, at least to a limited extent. Volvo has been a leader in developing DME powered diesel engines, and apparently Volvo has acquired Mack Trucks. A test of ten Mack DME trucks is underway with the New York City Sanitation Department. This is an ideal place to test these trucks, since a potential source for DME is garbage, reformed at high temperatures either by water - or by carbon dioxide followed by water:
Mack Trucks and New York Launch Dimethyl Ether Fuel Test Existing diesel engines can run fine on DME if minor modifications are made, chiefly the chemistry of polymer seals, changes to the injectors, and modifications to fuel pumps. Volvo/Mack has demonstrated it can do these things. Indeed, in many areas - New Jersey is one - one can see trucks and buses that display prominently that they run on "clean" natural gas, even though there is nothing at all beyond pure marketing to suggest that natural gas is anything like "clean" other than when it is compared to even worse fuels, petroleum or coal.
The major problem with DME concerns its lubricity, a factor for which methane is clearly worse. I am not familiar with the lubricity of the members of the OMen systems described in these papers, but by analogy with PEG (polyethlyene glycol) with which I have considerable experience, these papers, the unrealistic sources of primary energy notwithstanding, intrigue me, since I would expect the OMen ethers to be very soluble in liquified DME, representing a potential additive that would work to increase engine and pump life.
From the next paragraph of the introduction:
"Mobility is supposed to be environmentally friendly..."
Well perhaps...
While, again, I have no use for the car CULTure I believe that certain kinds of vehicles should be available in a just and sustainable human culture, things like tractors, delivery trucks, ambulances, etc...
Given the availability of DME, and perhaps these OMEn ethers as recovered from "waste" energy I agree these fuels hold promise, which is why I value this paper, my criticisms notwithstanding. The fact that the authors note that currently the OMEn ethers are being produced in China from coal, it is clear that they can also be produced from biomass or, for that matter, trash, sewage sludge and perhaps even algae, both present as contaminants of eutrophied bodies of water where it would otherwise choke the oxygen supply killing the ecosystem (as in the modern day Mississippi Delta), or as created in constructed wetlands to recover phosphorous from sewer water. Thus the last sentence in the reproduced paragraph can be qualified as partially true, with the caveat that "renewable feedstock" is not created by the thermodynamically inefficient use of electricity.
The authors' graphic on their proposed OMen system:
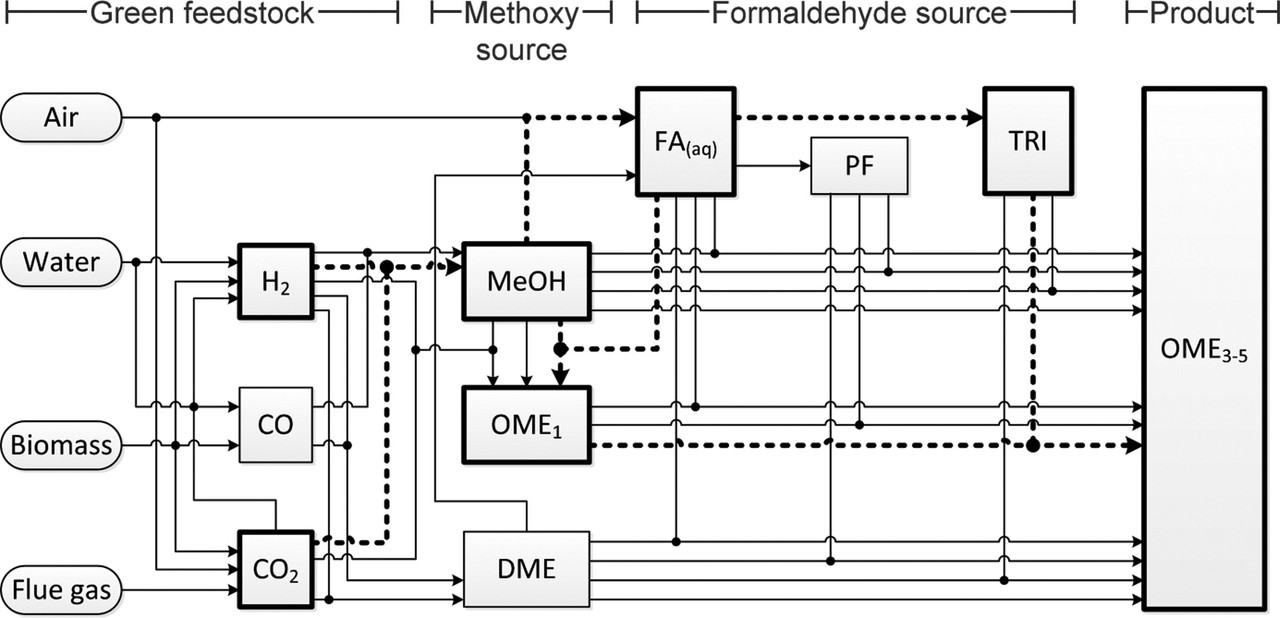
The caption:
There is in this paper considerable discussion of the "formaldehyde source" in terms of the chemical form in which the formaldehyde is delivered, that is in the nature of the "formaldehyde equivalent," the options being paraformaldehyde or 1,3,5 trioxane, shown in the graphic above in this post, in which the latter is incorrectly labeled "1,3,5 dioxane."
For the trioxane case, the following schematic is offered:
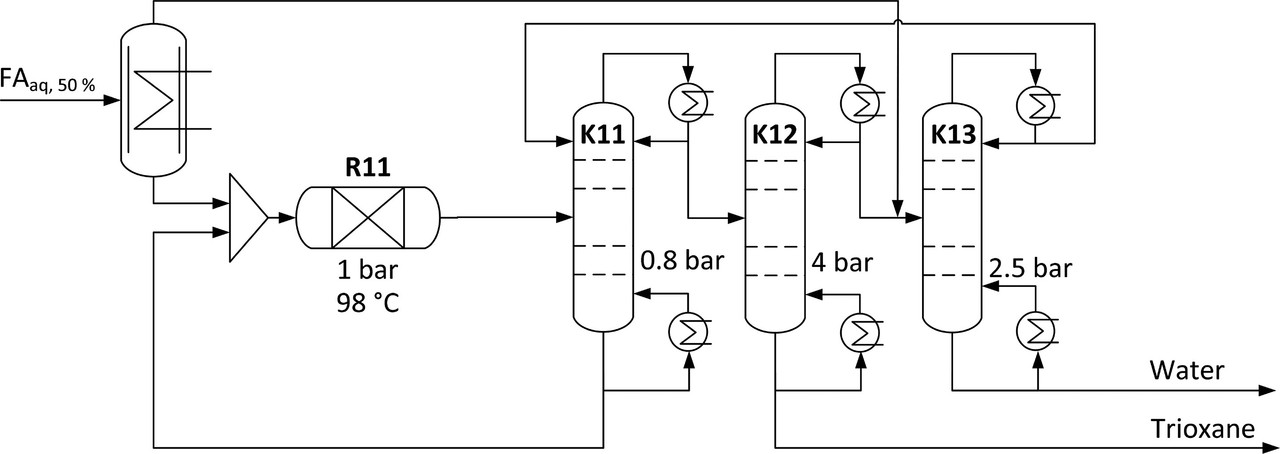
The caption:
Figure 2. Distillation-based trioxane production with three columns at different pressure levels, one falling film evaporator, and one reactor at the conditions given by Grützner.(49)
In a table in the text, the temperature of the R11 reactor is assumed to be 98 °C; the maximum temperature in the K-11 module is 93 °C; in the K-12 module, 165 °C; in the K-13 module, 127 °C. It is important to note, I think, whether or not the authors consider it, although clearly they do a lot to consider process intensification, that the primary source of this heat is supposed to be so called "renewable energy" which, to return to the main point, is supposed to be variable. Turning the heat on and off, this at high temperatures well above the boiling point of water, depending on the uncontrolled availability of energy. In this light, all other calculations need to be taken with a grain of salt, at least in my opinion.
Some text associated with the production of the final product is worth considering:
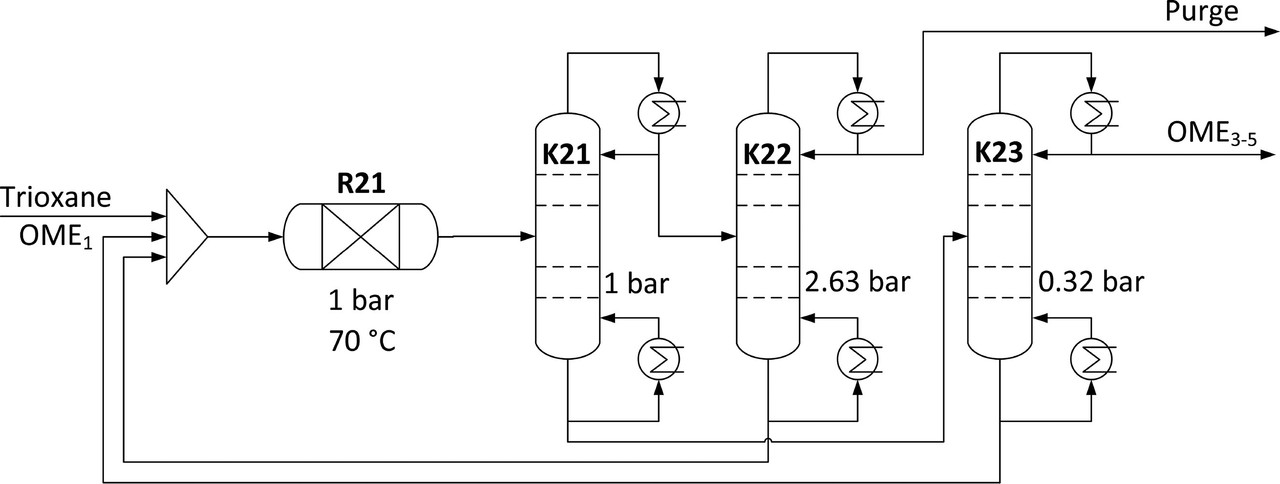
The caption:
According to the tables in the paper, R21 operates at 70 °C, K21 has a maximum temperature of 186 °C;K22 has a maximum temperature of 83 °C; K23 has a maximum temperature of 250 °C, temperatures again all to be provided by the use of variable so called "renewable energy."
It is useful to take a look at the mass flow Sankey diagram:

The caption:
As an environmentalist, I really don't like that "exhaust" feature from air, since this represents the air oxidation of methanol, a toxic alcohol, albeit one found commonly in automotive window washing fluid, to produce formaldehyde. Personally I have a NIMBY reaction to living anywhere near a plant doing this, at least whenever the wind is blowing and/or the sun is shining brightly.
The authors write of the chemical reaction (mass) efficiency the following:

Concerning the amount of CO2 required for producing 1 kg of OME3?5, an overall carbon-based yield of 87% is reached.
As an aside, given what I think is the only form of energy that is environmentally acceptable and sustainable, nuclear energy, popular madness not withstanding, that the energy content of a kg of plutonium-239 is 80.2 million MJ, and thus equivalent of 419 million kg of OME3-5. A kg of plutonium could fit in a small coffee cup. Somehow, incredibly, there are a large number of people on this planet who think that dealing with the so called "waste" from quantities that can fit in a coffee cup is more problematic than dealing with the waste of handing millions of tons of waste, which is exactly what OME3-5 will become when it leaves a tail pipe.
No wonder we're seeing more than 35 billion tons of carbon dioxide waste indiscriminately and thoughtlessly dumped every year into the planetary atmosphere. We cannot think clearly.
It is very useful to look at the author's assumptions, some of which are likely to be more valid that others on a practical level.
Let me begin with a description of their assumption of how electrolytic hydrogen is made and whence the carbon dioxide is assumed to come:
Almost none of the world's industrial hydrogen as of 2019 is produced by electrolysis, and of that which is, very little is produced using PEM systems, even though commercial examples of PEM systems are known. The overwhelming bulk of the tiny fraction of hydrogen produced by electrolysis is produced in alkaline hydrolysis units, which I'll briefly discuss below in terms of their lifetimes and efficiency. It is worth noting from a purely environmental standpoint that PEM systems use Nafion proton exchange membranes, which are highly fluorinated polymers likely to have extremely persistent lifetimes and, when they do degrade, release highly persistent fluorinated gases. Who cares? I'll return to this consideration a little later, but for now, I'd like to consider the portion of the text that I, and not the authors have put in bold.
There are three implied cases here: One, the most telling is the statement about flue gas, indicated, once again that most"renewables will save us" fantasies, none of which have had any effect on the on going degradation of the planetary atmosphere, depend on the assumption of the continued access to dangerous fossil fuels. The use of flue gas for a carbon dioxide source, particularly for a fuel whose combustion gases will be dumped indiscriminately into the planetary atmosphere through tail pipes, is not acceptable. So there's that.
I personally believe that it will be necessary, given the indifference of our generation and all preceding generations to the dumping of carbon dioxide and entropy into the planetary atmosphere that future generations will be required and their and not our expense, to actively remove carbon dioxide from the air. But the handwaving in this context, a glib assumption that this can be done without enormous, absolutely enormous energy requirements is, frankly, obscene. As for biogas, well, I note that all the straw in China, all of it, amounts to less than one billion tons, this on a planet where the annual dumping of the dangerous fossil fuel waste carbon dioxide is on the order of 35 billion tons. Biogas will always be trivial on scale.
If you think this energy requirements to accomplish air capture can be provided by wind and solar energy, I really can't help you, because you are so divorced from reality as to boggle the imagination. So in this context, air capture is a non-starter. The evocation of it is pure hand waving.
The authors optimistically cite process intensification, as described above, for heat flows.
OK, maybe. I personally believe that process intensification is a very good idea, and most of my own musings about what we must do if we ever become serious - which in my view we aren't - involve process intensification. I note that whether process intensification involves clean and sustainable nuclear energy or less clean and less sustainable so called "renewable energy," this type of infrastructure does not really dominate world processing infrastructure. There are huge considerations in materials, chemical, and thermal engineering involved, less onerous, I believe, in the nuclear case than in the so called "renewable energy" case.
In either case, such infrastructure does not exist currently.
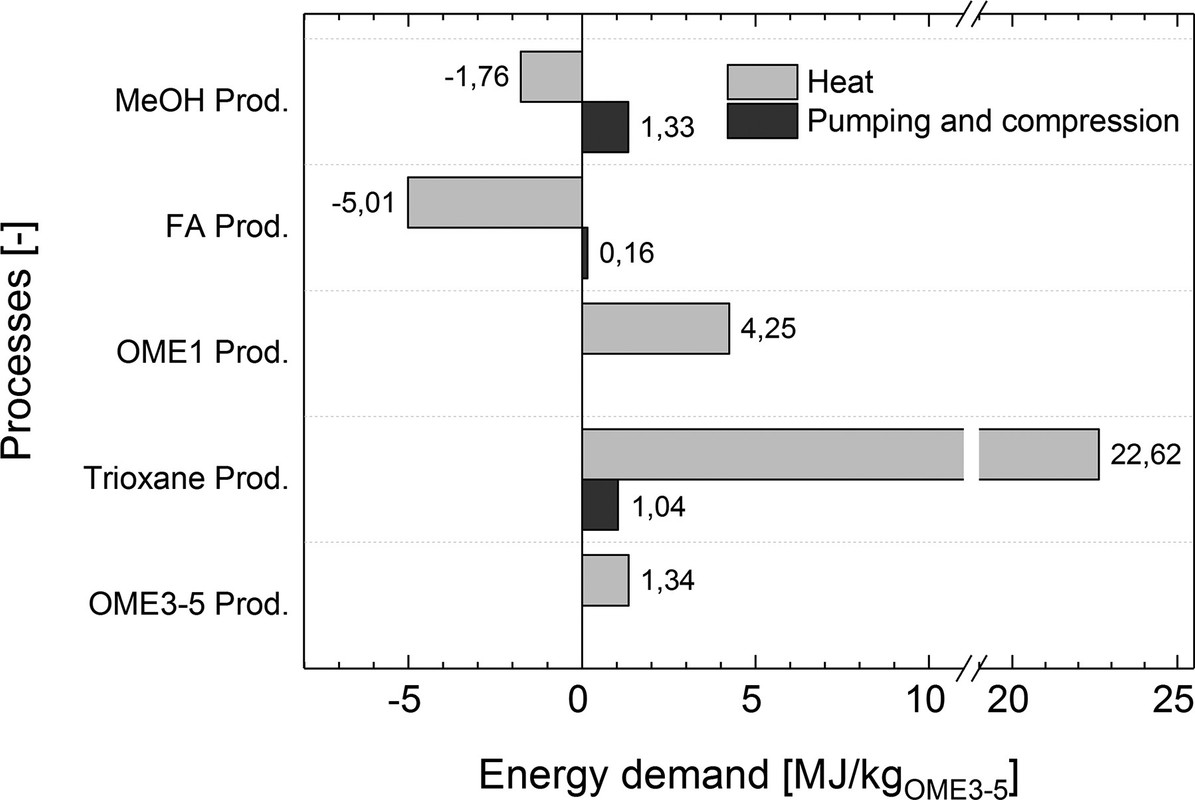
Sundry other considerations, compression, expansion, etc. They are neatly summed up in the graphic below:
The following graphic refers to a process detail concerning the degree to which formaldehyde is converted to its cyclic polymer trixoane.
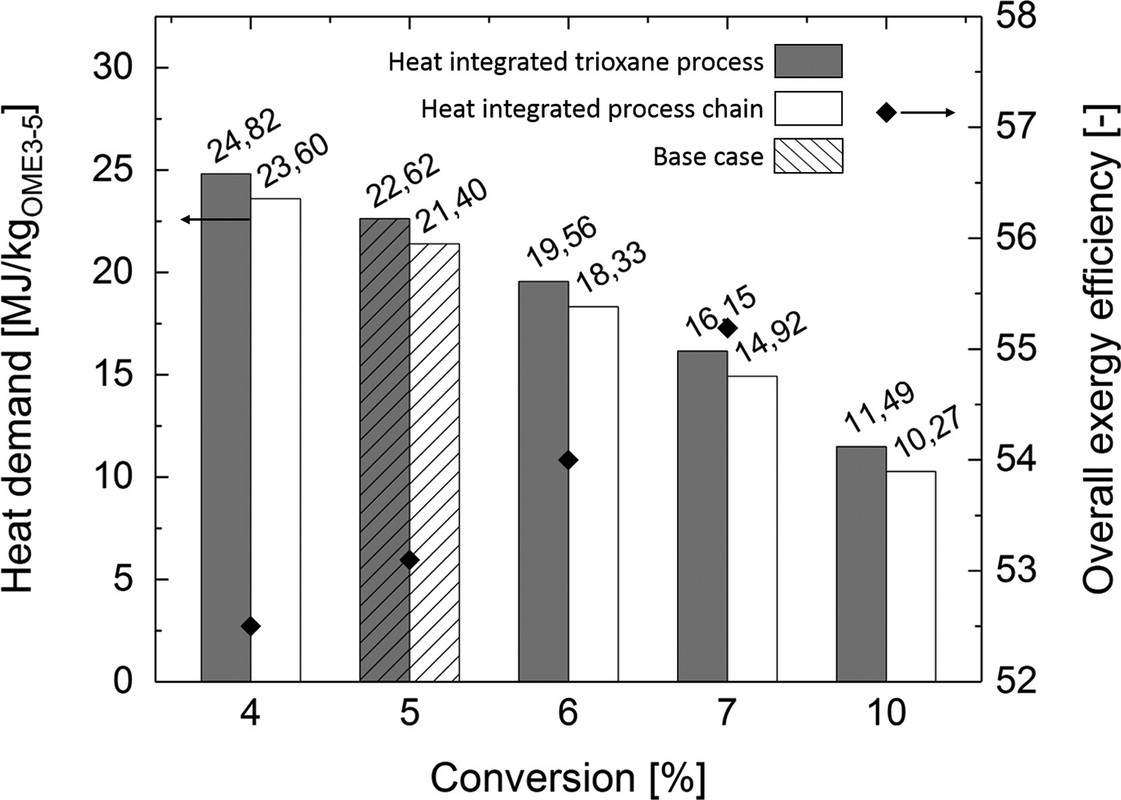
The caption:
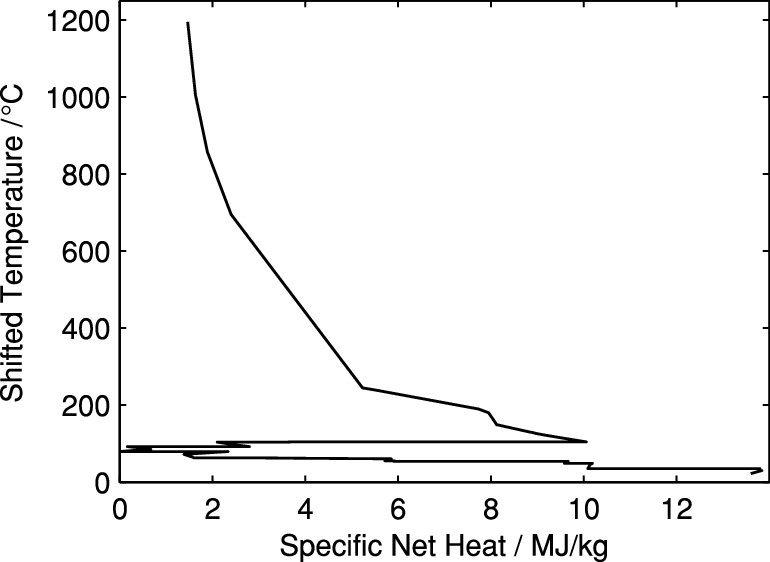
It doesn't matter much. What does matter is the overall energy efficiency of the process, described in the following Sankey diagram, which requires some reference to the text, to avoid it being too misleading:
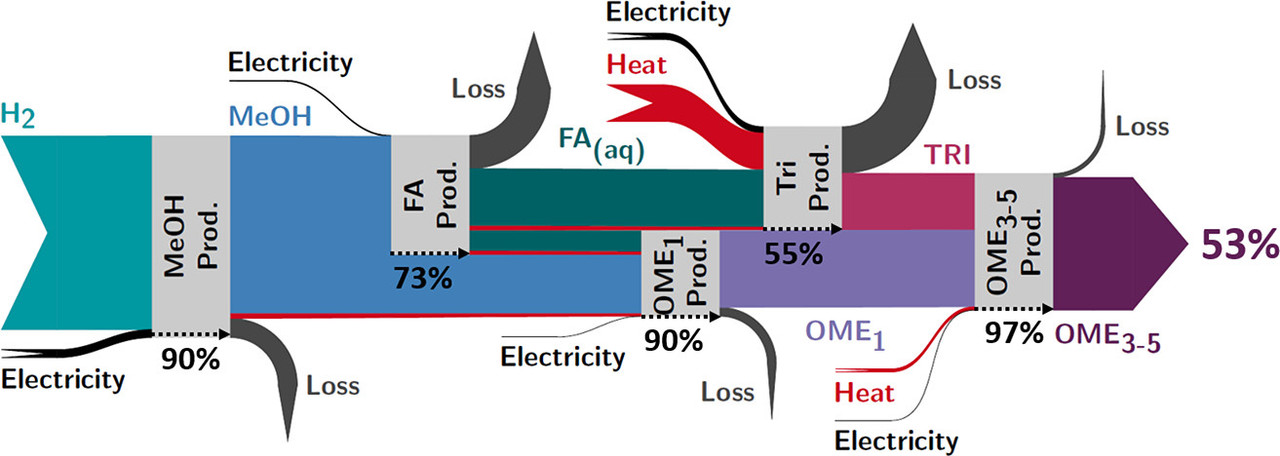
The caption:
The 53% figure is, of course, consistent with the case I often make whenever I hear dreamy bullshit about how easy it will be to overcome the fact that so called "renewable energy" is intermittent. I contend quite the opposite, that it is not easy, nor, given the unacceptable environmental impact that so called "renewable energy" has while remaining trivial, will it make so called "renewable energy" better. The opposite is true. It will make an already unacceptable environmental impact worse.
However, I know from years of study that we have not only dumped the dangerous fossil fuel waste carbon dioxide on all future generations as an expression of our contempt for them; we have also dumped entropy. While the quantities of carbon dioxide are tremendous, the concentration is dilute. It will take thermodynamic work to concentrate it.
Thus one may ask, is it really the case that the efficiency here is 53% as the graphic implies?
Let's look at the following text:
Before turning to the sentence I have put in bold in the above excerpt, let me say this: There are very few commercial hydrogen electrolyzers that operate at 80% efficiency. This paper lists the top 15 commercially available units and calculates their efficiency:
Hydrogen Production From Water Electrolysis: Current Status and Future Trends (Proceedings of the IEEE Vol. 100, No. 2, February 2012, 410-426). Only three of them demonstrate efficiencies this high; two are alkaline bipolar electrolyzers, one is a PEM unit. The others listed all range from below 50% efficiency to roughly 75% efficiency. Moreover, this paper, Applications of power to gas technologies in emerging electrical systems (Andrea Mazza⁎, Ettore Bompard, Gianfranco Chicco Renewable and Sustainable Energy Reviews Volume 92, September 2018, Pages 794-806) lists some factors that put lie to the claim that alkaline electrolyzers are really suitable in any fashion whatsoever to work with variable and intermittent energy. To wit:
However, some drawbacks still have to be overcome [21,23] concerning:
• The minimum load. It is not possible to operate the electrolyser over the 0÷100% Pn range: the minimum load usually falls within the 10÷40% Pn range [37], even though a case with 5% Pn is reported in [38]. This means that if the input is lower than these limits, the electrolyser has to be switched off.
• Transient operation is possible with this technology, but some problems can arise: in fact, the typical response time is seconds or minutes, but according to [37], these are not physical limits, but only design limits that depend on the absence of a fast response by the customers.
• The relatively long cold start time (10 min to h), which mainly dependson the purity of the gas [37].
• The long restarting time after shutdown. This is an important drawback, because the electrolyser takes 30–60 min before it can be switched on again (due to purging operations with nitrogen)
In other words, some of the energy said to be available for storage will necessarily be wasted just waiting for the time for the reaction to start, low load variations can effect the efficiency and performance.
PEM electrolyzers perform better, but cost twice as much money, often require elevated temperatures to operate, and - important to any consideration of scale - billions of tons of oil are burned each year - they involve a lot of highly fluorinated polymers, this in a time where fluorinated carbon compounds are emerging as major intractable persistent pollutants. The lifetime of PEM electrolyzers is thought to be on the order of 5 to 20 years before they require replacement.
And now let's turn to the text from the OME3-5 paper which I have put in bold, the bold being this remark:
Recall the remarks made earlier in the paper, to wit:
Of the three sources listed, one is likely to be available only on a small scale (biogas plants), one (flue gas) a confession that the use of this so called "renewable energy" like the rest of this crap assumes and depends on the availability of dangerous fossil fuel, and the last, air, is extremely dilute, 0.0414% (414 ppm) as opposed to 13%. The extra dilution means the requirement for extra energy to overcome the entropy of mixing, huge amounts of energy.
(I've spent many years pondering this problem. I believe air capture is on the edge of technically possible, but the engineering and energy challenge is vast, and no, no one is going to do this with solar and wind, except in wholly delusional dreams.)
For a nice overview of the thermodynamics of air capture of carbon dioxide, one may check out the widely cited paper by House, Economic and energetic analysis of capturing CO2 from ambient air (House et al PNAS December 20, 2011 108 (51) 20428-20433). The paper has been the subject of some criticism which I think (or I hope) may be justified.
Speaking of justification however, we are probably justified in assuming that "flue gas" will be available for a long time, since the common pop perception is that so called "renewable energy" is an effective means of addressing it persists. This is an affectation that has nothing to do with reality of course: So called "renewable energy" has not replaced, is not replacing and will not replace dangerous fossil fuels.
One of the world leaders authorites on and leading researcher on direct air capture (DAC) of carbon dioxide is Doctor Christopher Jones of Georgia Tech. A few years back he wrote a nice reviews of the subject of air capture of carbon dioxide: Direct Capture of CO2 from Ambient Air (Jones et al, Chem. Rev., 2016, 116 (19), pp 11840–11876). In it he refers, in detailing the difference in requirements for capturing carbon dioxide from flue gases and direct air capture and gives us some information about the concentration of carbon dioxide in these various streams. To wit:
The bold and the italics are mine.
In other words, to assume that one can obtain as overall thermodynamic efficiency as high as 38% - not the 53% graphically represented in the Sankey diagram - one must also assume that one will still be burning coal to obtain the carbon dioxide to make motor fuels from solar and wind energy.
Now that puts a slightly different spin on the whole affair, does it not?
Later on in the review Jones writes:
Reference 215 is this very interesting paper: Importance of Ambient O2 for Electrochemical Enrichment of Atmospheric CO2 (Chuan Wang†, Hong Liu*†, Xiangzhong Li‡, and Linze Zheng# Ind. Eng. Chem. Res., 2013, 52 (7), pp 2470–2476) with which I was unfamiliar until just now, even though it was in my files.
Reference 216 is the House paper to which I referred above.
By reference to the text of the House paper one can see that the 400 kJ/mol figure was not actually a target for active air capture of carbon dioxide but rather a "break even" point for getting electricity from dangerous natural gas, on which, increasingly, 8 years after House's publication, the world is increasingly investing, albeit with lots of delusional horseshit being thrown around about how wonderful so called "renewable energy" is. To wit:
The bold is mine.
Well then. OK.
The amount of plutonium that contains enough energy to remove a mole of carbon dioxide from the atmosphere, at 400 MJ/mol is about 5 milligrams, an amount so small as to be near the limit, maybe of what one can see with the naked eye, if one has excellent vision. It might require a microscope; I don't know; plutonium metal in all its phases is pretty dense.
A mole of carbon dioxide is 44.01 grams, meaning that there are 22.7 moles in a kg of carbon dioxide, corresponding to roughly 9.1 MJ/kg to capture carbon dioxide from the air! (There are better approaches, I think, to removing carbon dioxide from air via seawater, but that’s an entirely different topic.)
Be that as it may as I often point out, coal has been the fastest growing source of energy in the 21st century. It's not going anywhere, even if the United States is shutting coal plants and replacing them with gas plants; the US is also on a criminal path of shutting nuclear plants and replacing them with gas plants, the crime being against humanity, against all future generations.
Let's be generous, even if too much generosity is, as such, a crime against humanity, and ask how much must the solar and wind industry grow in order to replace, as suggested in this paper, all the world's petroleum with solar and wind energy if we blithely assume we will still be burning coal and having 13% carbon dioxide flue gas after deciding to build a huge solar and wind infrastructure to support a huge infrastructure to make chemical plants to make the OME3-5 fuel.
How much solar and wind energy would be required?
Whenever I post reference to the 2018 Edition of the World Energy Outlook Table 1.1 Page 38 to show exactly how useless, after half a century of cheering, so called "renewable energy" is I write the following:
Let me not do that now. MTOE is the abbreviation for "million tons oil equivalent" and it "assumes" a "standard" form of oil even though in real life, oil's energy content depends heavily on its geological/geographical source. The MTOE figure for oil consumption in 2018 is reported in table 1.1, Page 38 as 4435 million tons oil equivalent. That means that in 2017 the world consumed roughly 4.4 billion tons of oil.
Here, from the paper, is the accounting for the efficiency of the conversion process from carbon dioxide to OMe1-3 motor fuel:
Now of course, if one obtains the carbon dioxide from the flue gas of a coal plant, recovers it using so called “renewable energy” to make motor fuel for a car– not likely but let’s play pretend – it should be obvious to anyone with an ounce of sense that it still ends up in the atmosphere and represents a dangerous fossil fuel converted into the dangerous fossil fuel waste carbon dioxide. But suppose – again not likely but let’s play pretend – that the carbon dioxide is recovered from air. What would be the efficiency then?
One can calculate this from the numbers provided in the previous excerpt and from the earlier remark in the paper that the OME3-5 has an energy density (Lower Heating Value) of 19.16 MJ/kg. (We use the lower heating value because none of the work in an automotive engine results from the latent heat of condensation, i.e. the gases emerge from the pistons in the vapor phase and at elevated temperatures.) By reference to the mass based Sankey diagram above we can see the “stoichiometry” of the reaction, i.e. that 0.25 kg of hydrogen reacts with 1.83 kg of carbon dioxide to yield 1 kg of OME3-5. At the 383 kJ/mol reported in the Wang paper for their lab scale device, should it be scalable to industrial use, we can determine from the fact that, as above, a kg of carbon dioxide is 22.72 moles that a kg of air captured CO2 under these conditions would represent an investment of 8.7 MJ/kg at 383 (as opposed to 400) kg/mol . We multiply this by 1.83, add it to the claimed figure for electrolytic hydrogen (180 MJ/kg) times 0.25 and the figures for process heat, generously assuming the figures for the process intensified heat flows (17.94 MJ/kg OME3-5 produced). The sum of these figures so calculated is 78.9 MJ/kg
We thus find that the most optimistic case for carbon dioxide from air capture converted into OME3-5 gives a result of 24.2% overall energy process efficiency. If we were to replace all the oil consumed in 2017 according to the World Energy Outlook, 4.4 billion tons (4.4 trillion kg), we thus calculate that the total energy required to make 4.4 billion tons of OME3-5 would be 347 exajoules. Currently, again, after half a century of cheering, all of the solar, wind, geothermal, and tidal energy combined, as of 2017 was producing 10.63 exajoules. Thus, in the “percent talk” so favored by advocates of so called “renewable energy” the scale up would “only” be 3,264%, this only for motor fuels for our beloved cars and trucks, not for electricity.
Actually though this is a low estimate.
Here is a calculator for determining the lower heating value of various fuels: Hydrogen Tools Lower and Higher Heating Values of Fuels
Here are the figures in MJ/kg that I have obtained using it:
US Standard Diesel: 42.78 MJ/kg
Crude Oil: 42.68 MJ/kg
Fischer-Tropsch (FT) Diesel: 42.45 MJ/kg
Dimethyl Ether (My preferred fuel): 28.87 MJ/kg
All of these fuels have higher lower heating values than OME3-5. (Methanol comes in at 20.09 MJ/kg.)
Thus at 19.16 MJ/kg OME-3-5 has only, in percent talk, 44.9% of the energy value of crude oil. This means to displace petroleum, we would actually need 4.4 billion tons/0.449 = 9.8 billion tons of OME3-5. The energy required to make it from solar and wind would thus be 727 exajoules, greater than world energy consumption for all purposes in 2017 (584.98 exajoules), all from solar and wind, requiring a scale up, just for motor fuels, of "only" 7,272% in "percent talk."
No problem, I'm sure, given that solar and wind are purely magical.
It is worth considering how much steel and how much aluminum and how much copper would be involved in producing 727 exajoules of so called “renewable energy.” A commentary in Nature Geoscience a few years back discussed precisely this issue: Metals for a low-carbon society (Olivier Vidal, Bruno Goffé & Nicholas Arndt, Nature Geoscience volume 6, pages 894–896 (2013)) To wit:
I have put in bold the energy required as opposed to the peak power figures traditionally utilized in the big lies attached to so called "renewable energy's" alleged growth, growth that in units of energy is absurdly trivial given all the noise made.
12,000 TWh is 43.2 exajoules. By simple math 727 exajoules is 16.8 times larger, or in "percent talk" 1,680% more than what what the WWF predicted for wind and solar in "by 2050" talk.
The translates into 53 billion tons of steel, 5.2 billion tons of aluminum, and 673 million tons of copper. The production of steel involves coal, the current process for the production of aluminum utilizes petroleum coke electrodes (which are oxidized), and copper involves intense heat and the release of copious quantities of sulfur oxides.
Renewable? Really? Whither the ores for this pixilated process?
In the current issue of Nature an editorial writer deplores the fact that scientists in general do not publish negative results, experiments that fail. Rein in the four horsemen of irreproducibility
Although her remarks are geared to social science studies, they are relevant to other studies and bear reflection. She writes:
That has begun to change for two reasons. First, clinicians have realized that publication bias harms patients. If there are 20 studies of a drug and only one shows a benefit, but that is the one that is published, we get a distorted view of drug efficacy. Second, the growing use of meta-analyses, which combine results across studies, has started to make clear that the tendency not to publish negative results gives misleading impressions.
I certainly agree that if we made a habit of publishing negative results, a lot of effort, time and money could be saved; but of course, many of us are guided by belief and will not read or accept negative results. For instance, there are a whole set of Americans, including the idiot who nominally leads this country who refuse to believe that carbon dioxide is killing the planet. For another example there are a whole set of Americans and other people around the world who believe that so called “renewable energy” is a viable approach to addressing the carbon dioxide crisis. The negative result that carbon dioxide is destabilizing the weather is readily observable, as is the negative result that the expenditure of trillions of dollars on so called “renewable energy” has done absolutely nothing to slow the accumulation of carbon dioxide or protect future generations of human beings and other life forms.
The result of both beliefs stated in the last sentence is the same. The planet is being destroyed, not because it has to be, but because in both cases seeing is not believing.
To the credit of the authors of the study of the OME1 and OME3-5 papers under consideration, they draw a negative conclusion from their work, i.e. that these fuels are almost certainly not worth pursuing:
The reference for the efficiency of "other e-fuels" by the way is open sourced. It is here:
E-Fuels?Mehr als eine Option; DECHEMA, 2017.
It's in German, but even if you don't speak German, it is worth at least looking at table 1. The numbers for the various devices there are in general, fairly reasonable in my experience, at least within 10% in most cases, but they need to be taken with a grain of salt. For example, the German word for "battery" is very much like the English word, and shows 95% energy efficiency, which is true, as the first graphic I produced in this post suggests, for some batteries, but hardly all of them, and the manufacturing cost is ignored. The reported efficiency (Wirkungsgrad) in this table for an electric motor - Elektroantrieb - is 90%. This suggests that an electric car, which uses both devices has an efficiency of 90% * 95% = 85.5%. However, as discussed near the beginning of this post, the electricity to charge the battery is not primary energy, but rather is a form of energy transformed from primary energy. Almost all of the world's electricity is still produced in power plants running on dangerous fossil fuels, with a Carnot efficiency of 33% - Combined cycle gas plants are higher, but still generally less than 50% efficient. Thus most electric cars have an overall energy efficiency of 85.5% * 33% = 28.2% efficiency which is lower, according to this table than the efficiency of an internal combustion engine, which is reportedly 30%. (The beautiful compound German word for internal combustion engine is Verbrennungskraftmaschine.)
I recently went to pick up my son his university for a weekend visit for the Easter Holiday, but he wasn't quite ready to leave when we got together. He wanted to complete an assignment due at midnight before going home so I suggested we hang out in the library. I left him to his work and wandered around the stacks, pulled a few books off the shelves that looked like a fun read. One of the books I pulled off the shelf in paper form was this one: Understanding non-equilibrium thermodynamics (electronic resource) : foundations, applications, frontiers / G. Lebon, D. Jou, J. Cases-Vázquez.
It is a good idea to look at books about subjects about which one thinks one already knows because most often there will be something that one doesn't know therein and thus one can deepen one's knowledge; and then there is the joy of seeing something beautifully and clearly written about a complex and somewhat popularly arcane topic. The first chapter of this book, a description of the history of thermodynamics, fits the category of "beautifully and clearly written," because it elegantly describes the mystery of thermodynamics, particularly on the description of what entropy is and how people came to understand both its existence and its implications. Entropy is not a state function for which one can pull out a device an measure directly, as one can do with temperature. (It included the interesting and compelling statement that none of what most people understand as equilibrium thermodynamics should actually be called thermostatics.)
The discovery of the concept of entropy – and the concept of energy itself - helped explicate the fact that thermodynamics is very much a function of path. In general, any thermodynamic process that proceeds via a path through electricity is poor. There may be chemical exceptions to this in some cases, for example the reduction of aluminum and titanium to their respective metals, or in issues involving morphology as in nanostructured coatings, but in the case where energy storage is the intrinsic goal this is true.
This brings me what I believe to be the only sustainable and environmentally acceptable form of energy, nuclear energy.
Developments in materials science have made it possible to increase the thermodynamic efficiency of dangerous natural gas plants from roughly 33%, the average value for a pure thermal power plant, to 50% or more in combined cycle plants which feature both Brayton cycles - like jet engines - and Rankine (normal thermal) steam cycles. In these plants, the exhaust heat from the high temperature Brayton cycle is used to boil water to drive a steam turbine. Although dangerous natural gas will never be an acceptable or safe fuel, this approach makes gas plants less odious since it converts more chemical energy into usable electrical energy than would otherwise be the case.
Almost all of the world's nuclear plants are dedicated to making electricity, and almost all of them likewise - although there are some exceptions - are Rankine cycle steam plants. (The Brayton cycle nuclear plants historically faced, during the golden age of nuclear plant construction, materials science limitations on their operations because of the high temperatures involved.)
Thus most of the primary energy in a nuclear plant is wasted energy; and in fact, although overall nuclear plants are responsible for almost no atmospheric pollution, in general, their thermal pollution is slightly higher than thermal pollution released by coal, gas, biomass and petroleum fueled power plants: The internal temperatures of nuclear fuels can be thousands of degrees Celsius in localized spots, and this heat must be removed to avoid Fukushima, Chernobyl, or Three Mile Island events, which despite much mindless selective attention directed at them, have had trivial environmental effects when compared to the growing use of dangerous fossil fuels.
There is no intrinsic reason connected with physics that nuclear energy plants need have the unacceptably low 33% thermal efficiency; as is the case with hybrid cars, much of the waste energy can be captured and put to use. This is especially true because of significant advances in materials science since the golden age of nuclear power plant construction, many of which derived from the aerospace industry where dealing with high temperatures was and is a necessary component. Early nuclear plants were built using technology from the 1940’s and 1950’s which was well before Yuri Gagarin and John Glenn orbited the earth. The golden age of nuclear power plant construction ended shortly after Eugene Cernan returned from the moon. Advances in thermally resilient materials continued after Cernan’s return of course, and this is why we can build combined cycle power plants now but couldn’t as late as the 1970’s. I say all this because the key to capturing the waste energy of nuclear reactors is raising the temperature at which they operate, designing them to operate normally at the temperatures which destroyed the Chernobyl and Fukushima reactors. Any refusal on your part to consider this possibility as being possible will not affect me in the slightest other than to make me aware that you know very little about either nuclear engineering or materials science.
Nuclear plants are capable of being utilized in a combined Brayton/Rankine system similar to dangerous natural gas plants with various kinds of gas coolants - my personal favorite Brayton working fluid would be the carbon dioxide used in the Western World's first commercial nuclear plant, Calder Hall, which operated almost half a century - without the noxious climate effects of dangerous natural gas.
But this would only address electricity, and not the manufacture of chemical fuels. In the chemistry case, we would have thermal energy converted directly to chemical energy (without an electricity intermediate) at very high temperatures, and when cooling these chemical fuels, it is possible to generate electricity (either Brayton, Rankine or both) while cooling the generated fuels as a side product. Such a system might well convert nuclear energy with very high thermal efficiencies, conceivably to efficiencies in excess of 70% as compared to 33% for the pure (Rankine) electricity generation.
I have written here and elsewhere on the internet, about thermochemical cycles, probably most recently here:
Cerium Requirements to Split One Billion Tons of Carbon Dioxide, the Nuclear v Solar Thermal cases. In this case the gas split was carbon dioxide; in many other cases the split gas would be steam. (The destruction of the Fukushima reactors was partially connected with metal catalyzed thermochemical water splitting to generate hydrogen, although a zirconium based controlled water splitting scheme would almost certainly not be effective.)
It doesn't matter which gas is split actually, hydrogen is always accessible from carbon monoxide; in fact 99% of the world's commercial hydrogen is made by the water gas reaction, which utilizes dangerous natural gas that is partially oxidized to carbon monoxide, and mixed with steam to produce hydrogen and carbon dioxide.
(One of the processes listed in the table in German to which I linked above is the “RWGS + CO2” process, the reverse water gas reaction, which is a neat way of splitting carbon dioxide to generate carbon monoxide and oxygen by consuming hydrogen. It’s been considered as a possible tool in human space flight.)
Of course, one still needs a source of carbon dioxide in order to split it.
A supercritical fluid is a fluid that is neither a gas or a liquid but has properties of both. (It is distinguished by the disappearance of heats of vaporization in its heating curves.) The supercritical point of water is 373.946 °C and the supercritical pressure is 22,060 kPa, just under 218 times the pressure of the atmosphere. When seawater is raised above this temperature at pressures higher than 218 atmospheres it separates into two supercritical phases, one that is essentially pure water and the other that contains nearly all of the salts. As the temperature rises beyond the supercritical point, all of the organic materials ultimately reduce water to form hydrogen and carbon dioxide.
One of the things that sort of bothers me as an environmentalist is the destruction of river delta ecosystems, either by eliminating water flows from the river (as in the Colorado River) or by loading chemicals into the water that kill all the life at their mouths (as in the Mississippi River.) The chemicals that destroyed the Mississippi River Delta are actually chemicals that are essential to life, fixed nitrogen and phosphorous. This, of course, is eutrophication, the loading of so many nutrients into water flows that the growth of algae explodes in them. The layers of algae become so thick that the lower levels are cut off from light and die and sink to the bottom of the body of water - in this case the Mississippi estuary - where they rot. The bacteria that rot them are aerobic and they greatly lower the oxygen levels in the water, leading to the death of species, crabs, oysters, shrimp, fish, etc that need higher levels of oxygen to survive than the bacteria do. The dead zone at the mouth of the Mississippi River, last I looked, was about the size of the State of New Jersey.
One of my favorite types of questions to hear - and one I personally employed more often when I was young and stupid - begins with the words, "Why don't 'they' just..."
No one ever stops to consider that 'they,' whoever 'they' are, may have thought about the same thing, but know excellent reasons why it won't work, or have tried it and showed why it won't work or simply lack the money to try it out.
In droughts in California and in New Jersey in my experience this is often the preface to the question "Why don't 'they' just desalinate water." In fact in many places in the world 'they' do just that, albeit at high cost, the desalination of water requires energy, irrespective of whether it involves ordinary distillation, flash distillation, RO membranes, ion selective membranes, whatever...
I've had a "why don't 'they'..." question about the Mississippi Delta floating around in my head, but more or less assumed that there was probably a good reason why 'they' don't utilize the Delta's algae as a source of carbon and phosphorous recovery. And while it seemed like a pretty good strategy to me, I certainly realize that as a species we are too invested in satisfying the stupid and the irrationally fearful to recognize a practical way to do this other than write long press releases how "by 2100," when the person writing the release will be dead, we'll all live in a "renewable energy" nirvana where we'll have plenty of energy from the sun and the wind do do whatever we want.
As it happens, while having this "why don't 'they' question bouncing around in my head for a number of years without looking into it, since I recognize that the irrational hatred of nuclear energy is killing ecosystems at an increasing rate and no one give's a rat's ass about it, I noticed just last week that there is a 'they' who are actively considering this approach.
The paper is here: Characteristics of Cyanobacterial Biomass Gasification in Sub- and Supercritical Water (Huiwen Zhang* , Xiaoman Zhang, Lei Ding, Jiangya Ma, and Yanli Kong,* Energy Fuels, 2019, 33 (4), pp 3239–3247)
From the text:
The experiment:
The temperatures involved were as high as 500°C, supercritical water temperatures. The operative thing here is that the biomass did not need to be dried. At these temperatures the constituents of syn gas, carbon dioxide, hydrogen, carbon monoxide (as well as methane, ethane and propane were generated, all in appreciable quantities.
Of course, there is no intrinsic reason to limit temperatures to 500°C in an age where thermal barrier materials exist and where refractory and machinable metalloceramics, many carbide based, are known.
At 1400°C, the temperature at which the cerium oxide based system that I discussed in this space and linked above decomposes both or either steam and/or carbon dioxide into carbon monoxide or hydrogen, the lower saline phase in supercritical seawater would be above the melting point of all the salts therein and, in the case of super critical seawater from the Mississippi Delta, all of the algae, all of the microplastics, all of the larger pieces of plastic, all of the residue of the Deepwater Horizon disaster that took place while we all waited lazily for the so called “renewable energy” nirvana that never came, is not coming and will not come, would be rendered into hydrogen and carbon oxides – syn gas – all most of of the phosphorous from the grand renewable corn ethanol scheme that destroyed the delta would be recovered. The superheated flows of steam, carbon oxides and hydrogen would be available for all kinds of process intensification schemes, distillation of fuels for those mobile devices that would be wise to keep (as opposed to cars), rescue helicopters, freight vehicles, tractors, ambulances, etc, including the wonder fuel DME and potential lubricity agents like the OME3-5 discussed above.
There are, I note, hundreds of possible known thermochemical cycles for splitting carbon dioxide or water, some involving metals like zinc, copper, cerium and the alkali metals, as well as inorganic species as in the sulfur iodine cycle and variants therein. For amusement, I dream up some of my own.
Seawater, by the way, contains about 60 times more carbon dioxide on a weight basis than air, and thus the ocean would be an extractor for commercially recoverable carbon dioxide and it would be far more thermodynamically feasible, and thus environmentally and economically feasible to remove carbon dioxide from the air via seawater.
As for the nuclear fuels themselves, one of the things we should have learned at Chernobyl and Fukushima is that the most problematic fission products are those which are volatile and that it is possible to distill, and under appropriate conditions collect them to do useful things. In fact by careful timing of the transfer to various containers during decay of short lived radioactive xenon isotopes, one can obtain isotopically separated cesium isotopes, and collect valuable and expensive stable xenon isotopes for lighting and other applications.
By extension, every energy related mine in the world could be shut, coal mines, fracking fields for oil and gas, offshore oil and gas wells. It is possible, in fact, to shut all of the world's uranium mines if we build a new type of brilliant reactor concept advanced most prominently by the Japanese nuclear engineer Hiroshi Sekimoto, the "CANDLE" concept, "CANDLE" being a somewhat tortured acronym from "Constant Axial shape of Neutron flux, nuclide densities and power shape During Life of Energy producing reactor." Application of candle burnup strategy for future nuclear energy utilization (Hiroshi Sekimoto, Progress in Nuclear Energy; Vol. 47, No. 1-4, pp. 91-98, 2005). Many variants of this concept have been advanced, the most notable being Bill Gates' "Traveling Wave Reactor" put forth by his company Terrapower, which is the closest to commercialization.
Under these conditions the uranium and thorium already mined - the latter being contained in the mine tailings for the lanthanides we use for our wonderful electric cars and our wonderful wind turbines - would be sufficient to address all the world's energy needs for centuries, since depleted uranium and dumped thorium will be translated from "waste" into valuable fuels.
When I consider my own versions of "breed and burn" biphasic reactors - not that anyone cares what I think - I evaluate them in terms of on line processing, involving nitride fuels, uranium nitride for those sparked by isotopically degraded plutonium, and thorium nitride for those sparked by either neptunium and americium, I consider their potential for on line reprocessing, for the on line recovery of valuable fission products which, if allowed to escape, as at Chernobyl or Fukushima, are problematic, although the health consequences of these two accidents are dwarfed by the health consequences of dangerous fossil fuel waste.
Everything I've written here flies in the face of what has popularly come to represent modern liberalism, but I am a throwback to another time, a time when protecting natural spaces from development was more important than converting them into industrial parks for wind turbines to power electric cars for bourgeois consumers, a time that liberalism involved caring about the fate and lives of the poorest of the poor rather than demanding that these people be enslaved to dig cobalt for lithium batteries, a time when human advancement in a truly sustainable with equal justice and equal opportunity.
This is not the world in which I live anymore.
As for energy and the environment, I flatter myself to reflect on the early environmentalist John Muir, founder of the Sierra Club (which has evolved in modern times into a promoter of wind industrial parks in the middle of forests and marine ecosystems), who fought against the industrialization of the Hetch Hetchy valley and lost; the valley has been lost forever with the building of a hydroelectric dam.
Glenn Seaborg, scientist, diplomat and administrator, was famously a Democrat, and we, the modern Democrats, have forgotten that entirely how to respect his work.
Nevertheless, all this aside, as I approach the end of my life, these things matter to me, and I feel compelled to write them down, and to learn by writing about them, as I have here, even if they are too long, too turgid, and too technical for anyone to actually read.
In Greek mythology, Cassandra, the daughter of King Priam of Troy was cursed to be able to know the future, to understand it perfectly including the destruction of her city state, and to predict it all, but to not be believed. It was a terrible curse but she did what she could, and I love the thought of her as I love myself. Her fate was to be raped, while clinging to the image of her god, and eventually murdered. That won't happen to me, but still...

Ajax and Cassandra, 1806, Johann Heinrich Wilhelm Tischbein (1751–1829) at the Großherzogliches Schloss Eutin, Germany.
I trust readers, if any, will enjoy a pleasant Sunday, and perhaps think happy thoughts when viewing the cartoon at the beginning of this post.
New Weekly Record High for Carbon Dioxide Established at Mauna Loa.
From the Mauna Loa Carbon Dioxide Observatory:
Up-to-date weekly average CO2 at Mauna Loa
Week beginning on April 14, 2019: 413.59 ppm
Weekly value from 1 year ago: 410.99 ppm
Weekly value from 10 years ago: 388.66 ppm
Last updated: April 21, 201
The increase over 1 year ago is 2.60 ppm.
The value recorded here, 413.59 ppm, is the highest weekly average reading ever reported at the Mauna Loa Observatory.
If the fact that this reading is 24.93 ppm higher than it was ten years ago bothers you, don't worry, be happy. I read right here on the E&E pages that solar power installations are on the rise in Minnesota.
My impression that I've been hearing all about how rapidly solar energy has been growing since I began writing here in 2002, when the reading on April 14, 2002 was 375.14 ppm should not disturb you, since it is better to think everything is fine rather than focus on reality.
In this century, the solar, wind, geothermal, and tidal energy on which people so cheerfully have bet the entire planetary atmosphere, stealing the future from all future generations, grew by 8.12 exajoules to 10.63 exajoules. World energy demand in 2017 was 584.98 exajoules. Unquestionably it will be higher in 2019.
10.63 exajoules is under 2% of the world energy demand.
2018 Edition of the World Energy Outlook Table 1.1 Page 38 (I have converted MTOE in the original table to the SI unit exajoules in this text.)
According to this report, the fastest growing source of energy on the planet in the 21st century over all was coal, which grew from 2000 to 2017 by 60.25 exajoules to 157.01 exajoules.
If you think that unlike you, I am worrying and not being happy, you can always chant stuff about how "by 2050" or "by 2075" or "by 2100" we'll all live in a so called "renewable energy" nirvana powered by the sun and tooling around in Tesla electric cars.
I may be too jaded to be comforted, having heard this stuff my whole adult life - and I'm not young - but you could try. It's not results that count, but good intentions.
To those among us who are Christians, I wish you a Happy Easter.
New Weekly Record High for Carbon Dioxide Established at Mauna Loa.
From the Mauna Loa Carbon Dioxide Observatory:
Up-to-date weekly average CO2 at Mauna Loa
Week beginning on April 7, 2019: 413.13 ppm
Weekly value from 1 year ago: 409.46 ppm
Weekly value from 10 years ago: 389.50 ppm
Last updated: April 14, 2019
The increase over 1 year ago is 3.67 ppm.
The value recorded here is the highest weekly reading ever recorded.
This year has been somewhat anomalous, with a kind of plateau lasting through much of February and March, after the previous high ever recorded, 412.41 was recorded on February 10. Values ranged between 412.41 and 410.98, with an average of 411.98 since February 10, not including this week.
I began to suspect an early Northern Hemisphere spring; each spring the yearly maximum is reached for these readings.
In 1976, the first full year for which weekly data is available, the annual peak, 335.30 ppm was reached on May 23.
In 2016, it occurred on April 10.
It does see as the climate condition worsens while we all wait for the wind and solar nirvana that never comes, that the Northern Hemisphere spring, which dominates the carbon dioxide annual cyclic readings owing to the bulk of land mass being in the Northern Hemisphere, should be arriving earlier each year, but February seemed a little extreme, even to me, a person who has come to expect the worst.
The peak in 2018, 411.85 arrived comfortably late, May 13.
We do not know when the peak will come this year.
The increase over the same week last year is 3.67. Since 1975, 2254 such readings have been recorded. The increase represented here, again, 3.67, is the 45th worst ever recorded, placing it in the 98th percentile for "worst ever." The absolute worst ever, 5.04 ppm was recorded in the week of July 31, 2016, by comparison with the reading at the end of July in 2015.
If any of this troubles you, don't worry, be happy. I read here recently that the Wisconsin legislature approved a 5 fold increase in solar installations in that State. This has nothing at all to do with climate change of course, since all the solar energy installations installed over all of human history to endless cheering have done nothing to address climate change, although it should create lots of jobs for people sweeping snow off of solar cells in that state.
In any case, new solar farms in Wisconsin should be good for migrant workers, establishing a winter business, snow sweeping. If that doesn't work in Wisconsin, we can always burn more dangerous natural gas when snow is on the ground and on the solar cells and go a long way to eliminating, um, snow.
I hope you're enjoying your Sunday afternoon.
2019 Monthly Growth Figures for Carbon Dioxide Increases Are Among the Highest Recorded.
The monthly year to year increases in carbon dioxide concentrations are reported on the NOAA website for the last 55 years.
They may be accessed here: Mauna Loa CO2 Data Sheets
I have imported the monthly data into spreadsheets to use Excel functions to compare and order data from best to worst.
The worst data point ever recorded was a 4.16 ppm increase recorded in April of 2016 as compared to April 2015, about 15 years into the world wide adaptation of the "renewable energy will save us" anti-nuke scheme that prominently was adapted in certain European countries featuring Germanic languages.
The second worst ever recorded was in June of 2016, 4.01 ppm in June of 2016.
The worst January figure ever recorded was 3.61 ppm, recorded in January 2017.
The worst February figure ever recorded was 3.76 ppm, recorded in February 2016.
The worst March figure ever recorded was 3.31 ppm, recorded in March of 2016.
For 2019, January recorded a value of 2.85 ppm over 2018, the third worst ever recorded.
For 2019, February recorded a value of 3.40 ppm over 2018, the second worst ever recorded.
For 2019, March recorded a value of 2.51 ppm over 2018, the eighth worst ever recorded.
If any of this disturbs you, don't worry be happy. I recently read here that so called "renewable energy" subsidies in Texas are "working."
Apparently, in this mentality, "working" involves putting up lots of steel towers to grind up endangered and common birds and bats, and has nothing to do at all with climate change.
It figures. If "working" did involve climate change, then so called "renewable energy" did not work; is not working and will not work.
Have a very pleasant Sunday.
The External Cost, Including Climate Cost, of Stationary Batteries For Grid and Off Grid Power.
The paper from the primary scientific literature I'll discuss in this post is this one: Additional Emissions and Cost from Storing Electricity in Stationary Battery Systems (Schmidt et al Environ. Sci. Technol., 2019, 53 (7), pp 3379–3390)
My first exposure to the concept of life cycle analysis was when, years back, the European Union released it first ExternE reports, which attempted, in units of Euros, to monetize the destruction caused by the use of energy, that is the external costs, the cost of destroyed human health, destruction to the environment including but not limited to climate change, and the depletion of resources.
The figures in the early report showed - and this certainly caught my attention as my enthusiasm for nuclear energy, while firmly established, was accelerating at the time, even though, back then, I was still a fan of so called "renewable energy," - that the external costs of nuclear energy were the lowest calculated by the use of the variables then in use.
Ten or twelve years later, the general ExternE concept has exploded in the scientific literature, and now comes under the general rubic of "Life Cycle Analysis" often abbreviated "LCA."
If one puts the search terms LCA and Life and cycle in Google scholar, one will get about 179,000 hits, in 2019, over 3,400 as of this writing.
Many examples of software to calculate these costs in various units, for example, grams of CO2 per kWh for electricity generation by various means, or 2,4 dichlorobenzene equivalent for toxicological effects, and yes, in terms of money, dollars, euros, whatever. There is for instance, Ecosense, which appears regularly in the scientific literature but there are many, many other such programs.. No one person can possibly read all of the papers written on this subject, of course, but personally, I have come across perhaps a thousand or so over the years.
One needs to realize that these calculations contain a great deal of subjectivity, because intrinsically many questions connected with values arise.
To wit:
There are right now, said to be 849 whooping cranes left on this planet as of this writing. This is way up from the number a few decades ago, which was 21. The whooping crane is a very photogenic animal, quite beautiful:
 ?crop=2077,1180,x0,y15?width=1200
The bird has the largest wing span of any North American Bird. Whooping Cranes, when released in the wild, migrate from the Gulf of Mexico to Northern Canada each year.
There was a time in my life, a few decades ago, when people who self defined as "environmentalists" cared more about the whooping crane than about, for example, Elon Musk's stupid car for millionaires and billionaires.
Sigh...
Here is the whooping cranes' migratory pathway:
 ?resize=630%2C353
Notice that it goes right through Oklahoma and Oklahoma, those oil and gas drilling hell holes that votes repeatedly for ignorant rednecks to be their Senators, including the oblivious fool James Inhofe, one of the most prominent climate change denying assholes in the United States Senate, the US Senate being an organization that has degenerated into a club of morons controlled by the silly, cartoonish, Pravda wannabe channel propaganda channel, Fox News.
Of course, in modern times, we do have people who call themselves "environmentalists" who slobber all over Oklahoma with their ignorant "percent talk," since as a state, Oklahoma has one of the highest percentages of electricity produced by wind energy, which was, as of 2017, according to the EIA, 32%. Of course, this also means that the bulk of the electricity is not produced using wind energy.
This reminds me of one of my favorite engineering jokes: “ The optimist says the glass is half full; the pessimist says it's half empty, and the engineer says the glass is twice the size it needs to be.” Call me a pessimist, but I note that it is possible for the 68% of electricity not produced by wind to actually be greater than the zero percent case that applied in the case that overall consumption has grown to more than 147% = 100%/.68 of what it was a few years early. It is possible in percent case a system to be losing ground. This is, in fact, what is happening on the entire planet. All the so called "renewable energy" assembled after decades of mindless cheering, is not even close, not even remotely close, to matching the increases in overall energy consumption world wide.
Anyway, let's indulge in some "percent talk" with respect to Whooping Crane populations There are seven billion human beings on this planet, and it is a fact that this is way past the carrying capacity of the planet. If one whooping crane is killed by a wind turbine blade in Texas, it would represent roughly 0.12% - we all love percent - of the population, and would be in percentage terms the equivalent of killing 8,400,000 human beings. If another Whooping Crane is killed by a wind turbine blade in Oklahoma, that would be the equivalent of killing 16,800,000 human beings. If a third is killed in Kansas by a wind turbine blade, it would be the equivalent of killing 25,200,000 human beings, and so on through Nebraska, South Dakota, North Dakota, Manitoba, Saskatchewan, and Alberta.
We accept the deaths, year after year, decade after decade, the deaths of tens of millions of people – in this century we have accepted the death over 130 million people, almost twice the population of the United Kingdom – from air pollution without so much as a whimper, although many, many, many people refuse to accept Fukushima, thinking that it was more or less, the worst energy disaster of all time.
But in a purely scientific sense, the deaths of 130 million people will not have as much of an effect on the human population as the death of one whooping crane will have on the whooping crane population. Species that have suffered but survived a near extinction – cheetahs are well known example – have lost considerable genetic diversity, and the population as a whole, may lose genes that may prove critically important to survival as a result, for example, of extreme weather events. At one point, again, there were only 21 whooping cranes, and environmentalists of another time – a time when environmentalism involved more than platitudes about electric cars, solar cells and industrial wind parks that people imagine, albeit with considerable delusion, will make their consumer lifestyles “sustainable” - cared more about whooping cranes than wind turbines. Those historic environmentalists worked hard to get the population closer to 1000 than to 10.
(There is a nice open sourced overview of the genetic diversity of endangered species for interested "old school" environmentalists, discussing the utilization of modern "-omics" technologies such as gene sequencing: Conservation of adaptive potential and functional diversity: integrating old and new approaches(able, B.K. Conserv Genet (2019) 20: 89. https://doi.org/10.1007/s10592-018-1129-9))
The reason for this long riff about whooping cranes is that while some LCA analyses include the economic costs of human health and human loss of life, for example in DALY, (Disability Adjusted Life Years), as if we knew what a human being is “worth,” I don’t believe there are any which consider anything life the value of a species, whether the species in question is photogenic, like polar bears and whooping cranes and butterflies, or an ugly insect eating bat like the endangered Ozark Big Eared Bat (Corynorhinus townsendii ingens).
While LCA’s are valuable tools, one must be aware that the relative importance of any factor factors depends very much on one’s values.
By the way, in 2017, Oklahoma consumed, according to the full data tables that can be accessed here, 73,731,764 MWh of electricity. (I have alluded to one of these tables above, and will take much data below from one of these spreadsheet tables.) This represents an average continuous power of 8,400 MW.
In order to provide this much electricity (assuming 33% thermodynamic efficiency, although higher efficiencies are accessible), one would need to consume about 0.332 grams of plutonium per second, this while providing no threat to whooping cranes, or for that matter, the lungs of human beings. This could be accomplished in 5 or 6 buildings or small complexes. In a year, this would involve the production of less than 11 tons of potentially very valuable fission products.
Nevertheless, despite the sense of the former paragraph, ignorant people who know absolutely zero about plutonium but fear and hate it all the same, would rather fill tens of thousands of acres laced with bird and bat grinders - and maintenance and construction access roads - involving literally tens of thousands of tons of steel, aluminum, and huge quantities of exotic elements, all of which will require redundant systems because the wind does not always blow in Oklahoma or anywhere else.
Right now, and for the immediate future on a planet where the carbon dioxide atmosphere has risen to roughly 413 ppm, as compared to 371 ppm in April of 2000, the redundant system to back up the wind crap is dangerous natural gas and coal plants.
A capacity factor is the ratio of the energy actually produced to the nameplate capacity operating 100% of the time. One of the big lies told by people making excuses for the so called "renewable energy" industry's failure to address climate change, is to report peak power, in units of Watts, for so called "renewable energy" installations that might operate at 20% of capacity as if were the same as nuclear plants, most of which operate at close to 100% of capacity.
The 2017 capacity factors for wind turbines in Oklahoma ranged from 19.4% (August 2017) to 49.1% (March 2019). Overall the capacity utilization of wind power in Oklahoma was 40.3%, which, by the way, is very high compared to most wind systems on this planet. Oklahoma must be a windy place. I can't remember; it's been a long time since I was in that state. Nevertheless, the available electricity for these turbines had nothing whatsoever to do with demand. The average high temperature in August in Oklahoma City is 93F. Presumably people turn on their air conditioners. In August of 2017, the capacity utilization of combined cycle dangerous natural gas plants was 63.1%; in July 71.2%. The waste from these plants was dumped directly into the planetary atmosphere.
The average monthly capacity utilization for dangerous fossil fueled power plants in Oklahoma was below 50%. The capacity utilization of coal plants in Oklahoma was extraordinarily low for coal plants in general, 45.3%, for combined cycle gas plants, 46.0%. This means that these plants most of the time were stranded assets, thus degrading their economic performance. I personally couldn't care less, since I oppose all coal plants and all gas plants and diesel plants.
The same people who want to cover thousands upon thousands upon thousands of acres of the Whooping Crane migratory pathway with wind turbines will engage in every more cockamamie schemes to make this useless crap work, and they claim, without consideration of the possibility of long wind droughts lasting weeks, or maybe months that huge batteries will save the day.
This, finally, brings me to the subject of the paper referenced at the beginning of this post, the carbon cost (and other external costs) of batteries. I really enjoyed this paper because it looks at batteries on a deeper level than one usually sees, accounting for the types of batteries as represented by their chemistry, their geography, and - this is very important, I think - the purpose for which they are used. The fact that the first two sentences in this very fine paper are nonsensical statements of the popular imagination that are in fact urban myths rather than representations of reality has no bearing in my mind on the paper's quality.
These two sentences are:
Renewable energy technologies are not playing a "key role" in decarbonizing the electricity sector, which is by the way not being decarbonized. After half a century of highly inflated rhetoric about how wonderful so called "renewable energy" is, or more regularly could be, the solar, wind, geothermal and wave industries combined produced, in 2017, 10.83 exajoules of energy as compared to 584.98 exajoules of energy generated and consumed by humanity. Between 2016 and 2017, the output of all the world's wind, solar, geothermal and wave powered plants combined grew by 1.21 exajoules, compared to the growth in energy consumption (from all sources) of 8.88 exajoules. (Ref: IEA 2017 World Energy Outlook, Table 2.2 page 79 and 2018 Edition of the World Energy Outlook Table 1.1 Page 38. (I have converted MTOE in the original tables to the SI unit exajoules in this texts.)).
"Could" is a word used, with obvious contempt for all future generations, by the advocates of and apologists for the grotesquely failed so called "renewable energy" industry quite often. The use of the word "can" in the second sentence of this otherwise fine paper is dubious, since it has never been proved that so called "renewable energy" can do anything to reduce the carbon footprint of energy. In fact, the opposite is true on inspection, until the dawn of the 19th century, all of humanity almost exclusively survived on so called "renewable energy," but abandoned it, because most human beings, even more so than today, lived short miserable lives of dire poverty.
The remainder of the first paragraph of the paper gets a little more realistic:
The next paragraph includes reference some, but not all, of the criticisms that I make of people wanted to bet the planetary atmosphere on this cockamamie scheme to convert all of our ecosystems into industrial parks to produce so called "renewable energy" as well as a statement of the raison d’être of the paper:
With reference to the phrase "potentially displacing cleaner generation" many advocates of and apologists for the so called "renewable energy" industry attack nuclear energy, as opposed to dangerous fossil fuels, even though dangerous fossil fuel waste kills millions upon millions of people continuously and is the major cause of climate change, and nuclear energy, um, does neither. The so called "renewable energy" industry will never be as clean, as sustainable, as safe as the nuclear industry. This is not to say that nuclear energy is risk free; clearly it isn't. As I often say, however, the nuclear industry does not need to be risk free to be vastly superior to all other alternatives. It only has to be vastly superior to all other alternatives, which, by the way, it is. In this country, because of these appeals to selective attention, wishful thinking and pure ignorance a process of replacing nuclear plants with dangerous natural gas plants is well underway, with this selfish generation dumping all the external costs on all future generations.
More raison d’être for the paper:
Figure 1, on system boundaries:
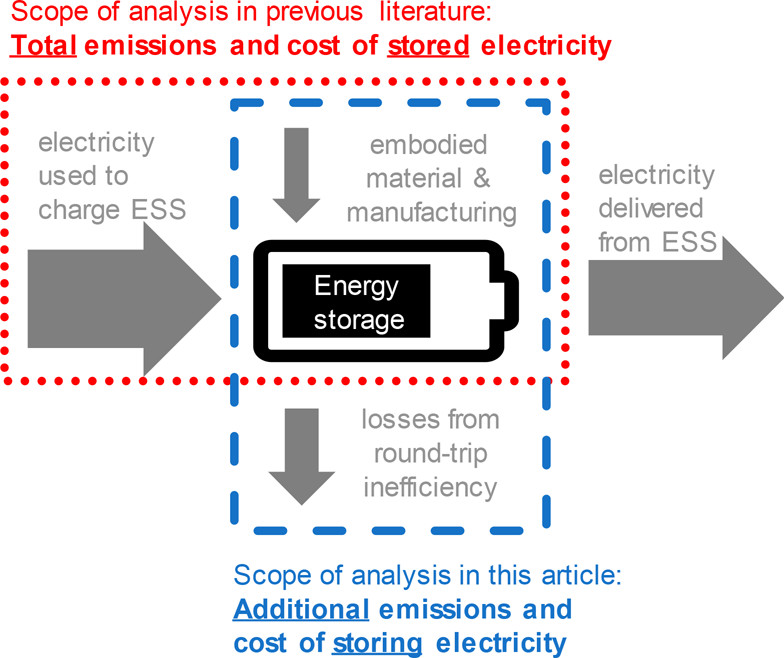
The caption:
This fine paper contains lots of abbreviations defined internally. Here is a description giving the abbreviations for types of battery chemistry explored in the paper:
The "gap" to which this text refers is that most papers focus exclusively on carbon dioxide external costs while not considering economics and the effects of geography, since as should be obvious from the fact stated above about the higher than usual capacity utilization of wind turbines in Oklahoma, more than 10% higher than that in Denmark, the wind does not blow with the same intensity or regularity every where, nor, although solar is even more trivial than the trivial wind industry, is the insolation the same everywhere: In some places it rains often or snows often; in other places this is less of a factor.
Other abbreviations in the paper refer to how the batteries would be or are used, which is also a very different factor. An interested reader if there is an interested reader can access the open sourced supporting information of the paper to get a detailed description of the types of use abbreviated. That supplementary material is here: Supporting Information
The abbreviations for types of use are these: WA, wholesale arbitrage, AF, area and frequency regulation, TD T&D, upgrade deferral grid, PS demand peak shaving commercial and industrial, SC increase of self-consumption residential end consumer. Again, the details of what these usage types are is in the supporting information.
Science is a mathematical enterprise, and here are some types of simple calculations that the paper utilizes:
...and...
where LCEbat is the manufacturing phase emissions for battery production, including all necessary replacements during a 20- year lifetime (CO2e/battery system), LCEel,charged is the lifecycle emissions of charged electricity (CO2e/kWh), kWhapp is the annual electricity delivered from battery (kWh/year), lifetime denotes the lifetime of the battery system (years), held constant at 20 years, and ? is the roundtrip efficiency of battery system (%). Please note that emissions related to the end-oflife phase are not considered in eq 2 because our analysis does not cover them, given the lack of available data.
The sections that I have put in bold by me and not in bold in the original paper refer to two points that I often make:
The first point is that the second law of thermodynamics - a law that is not subject to repeal by Edward Markey's so called "Green New Deal" which is not even close to being "green," since so called "renewable energy" is not sustainable nor can it be effective at addressing climate change (I say this as a lifelong Democrat) - is that storing energy wastes energy irrespective of the fact that advocates and apologists for the so called "renewable energy" also prattle on about energy efficiency with absolutely no appreciation of Jevon's paradox. Jevon's composed his paradox, by the way, at the time that the world was abandoning "renewable energy" to displace it with a "new" wonder fuel that he was contemplating: coal.
The second point is that the vast amounts of materials that support the so called "renewable energy" fantasy will become waste when the renewable energy facilities are no longer workable. Their observed and calculated lifetimes are incredibly short when compared to nuclear plants, even those built in the 1950's, like Britain's Calder Hall reactor, the first commercial nuclear nuclear reactor in the western world, a reactor built to put the "fear of God" into then regularly striking British coal miners. Appeal to the comprehensive Danish database of existing and decommissioned wind turbines gives a mean lifetime for this metal and concrete intensive technology of less than 18 years. Calder Hall ran for close to 50 years. Advocates and apologists for the so called "renewable energy" industry" engage in a lot of hand waving about recycling these vast quantities of matter, without even a remote understanding of the chemistry and environmental impact of recycling complex materials, of which batteries are merely a subset.
The current issue of Environmental Science and Technology from which this paper comes has two related papers, one on recycling batteries, and the other on the general limitations of LCA calculations, which do not include intangibles, like the existence of Whooping Cranes.
These are the two papers in question:
Upcycling of Spent Lithium Cobalt Oxide Cathodes from Discarded Lithium-Ion Batteries as Solid Lubricant Additive (Pol et al, Environ. Sci. Technol., 2019, 53 (7), pp 3757–3763)
...and...
Uncertainty Implications of Hybrid Approach in LCA: Precision versus Accuracy (Jessica Perkins and Sangwon Suh, Environ. Sci. Technol., 2019, 53 (7), pp 3681–3688)
From the first of these two papers, some text:
... Zhang5,6 X. et al. showed that trichloroacetic acid (TCA) and trifluoroacetic acid (TFA) along with hydrogen peroxide reductant can leach lithium and cobalt up to 90%. Yao L. et al. used D,L malic acid7 as a leaching agent as well as a chelating agent to recycle LiNi1/3Co1/3Mn1/3O2 (LNCMO, different type of cathode material). Santana I. L. et al. used citric acid8 as a leaching agent with enhanced recovery. To achieve higher metal recovery, Jie G. et al. used iron powder9 to reduce LCO first followed by acid leaching, which eliminated the use of peroxide. Furthermore, they enhanced the yield of valuable metals by optimizing the ball milling parameters...10
...Though these methods show fascinating results, it is very difficult to implement such ideas commercially, especially due to the high cost of leaching agents, waste generated, and purification requirements after use. Additionally, the secondary product, i.e., recovered LCO, requires enrichment of lithium to achieve a comparable battery performance as that of pristine LCO...
By the way, the moral cost of cobalt is not included in LCA calculations. My son bought me an interesting but painful to read book on the subject of human slavery in the United States, this one: The Half Has Never Been Told which argues that modern American wealth as well as historical American wealth derives from its unbelievably sordid history of human slavery. It's a compelling thesis. Modern lithium batteries also depend on slavery, modern African slavery in the Congo, because the largest fraction of the world's cobalt is obtained by using enslaved children as miners. This is the issue known as the Coltan crisis.
And no, recycling will not make that moral cost go away. Cobalt is a monoisotopic element. There is no way to trace its source, and in any case, for things like Elon Musk's magical car for billionaires and millionaires, we require more cobalt than that which has already been mined.
Some more math, touching on the non-inclusion of magical recycling techniques:

where CAPEX is the capital expenditures (EUR), OPEX is the operation and maintenance expenditures (EUR), kWhapp is the electricity delivered as defined by application (kWh), r is the financing cost (%), and T is the battery system lifetime (years). Here, we neither consider end-of-life cost (e.g., for recycling) nor any scrap value.
It is important to note that simply comparing LCC does not take into account that the value of storage differs among applications. Therefore, LCC should not serve as the only metric for making investment decisions...
The all important thermodynamics of energy storage which would make so called "renewable energy" even less efficient than its already pathetic efficiency and production:

where ceff is costs incurred from efficiency losses, kWhapp is electricity delivered as defined by application (kWh), ? is roundtrip efficiency (%), and pel is price of electricity for charging the battery system (EUR/kWh). Total OPEX are derived by summing up fixed annual OPEX (see SI Table S4) and ceff.
At this point, it's probably worth it to look at the pictures. Before doing so, for reference, it is useful to keep figures in one's head for the carbon cost of the major forms of fuel on this planet used to generate electricity, which are the three dangerous fossil fuels, coal, gas, petroleum, nuclear and hydroelectricity. All of these generate more than 20 exajoules of energy per year. In this context, it is also worthwhile to consider the working figures for trivial forms of electrical energy generation, solar and wind. The figures vary widely, depending on where you read, but I'm going to use the figures from a paper written some time ago in a paper written by Paul Denholm, now at the National Renewable Energy Laboratory and coauthors in 2005 - I don't expect the figures will have changed much in the intervening years with respect to carbon dioxide. For coal he claims (900-1100 grams CO2 per kwh), combined cycle gas (400-500 grams CO2 per kWh) - he doesn't give figures for pure thermal gas, which are undoubtedly higher - for nuclear, 10-25 g CO2 per kWh and wind (no storage) 5-25 grams/kWh.
Denholm's paper is here: Emissions and Energy Efficiency Assessment of Baseload Wind Energy Systems (Denholm et al, Environ. Sci. Technol., 2005, 39 (6), pp 1903–1911.
With the exception of wind energy, which obviously depends on where the wind facility is located - a facility destroying thousands of acres in windy Oklahoma will be very different than an industrial wind park trashing the continental shelf offshore in New Jersey, these figures seem consistent with the many, many, many LCA papers I've come across. Denholm was writing about the environmental cost of storing wind energy using compressed air, assisted by dangerous natural gas to recover thermal losses from the cooling from gas expansion; he considered it would raise the carbon dioxide cost of wind energy to somewhere between 69-102 g CO2/kWh for the 5 types of turbines he and his coauthors considered.
In Denholm's paper, he was assuming that the wind turbines were in the American Midwest, and Oklahoma, with it's unusually high capacity utilization probably qualifies for what he may have been thinking. By the way, in the 15 years since his paper was written, the number of huge scale air compression energy storage facilities powered by the wind is essentially zero.
The carbon cost of solar facilities is also highly dependent on location, for example, if the solar cells are located on a roof in Phoenix, or if they are covered for weeks or months at a time by snow in Vermont. I don't think that people really appreciate the metal intensity of so called "renewable energy," even solar energy.
An overview of metals used in the solar industry, the other form of energy that is supposed to charge millions and millions of large scale batteries can be found in a paper by a scientist at PV Environmental Research Centera Brookhaven National Laboratory who writes quite a bit on the external costs of solar energy, Vasilis Fthenakis.
It is here: Life cycle inventory analysis of the production of metals used in photovoltaics (Fthenakis, Wang and Kim, Renewable and Sustainable Energy Reviews 13 (2009) 493–517)
For our 100% renewable "by 2050" or "by 2035" or "by 2100" and "by [insert year after you'll be dead]" I offer the following text excerpts from that paper:
...Teck Cominco Ltd. is one of the world’s largest indium producers, generating approximately 36 tonnes of high-purity (99.998% and 99.9999%) indium per year. It recovers indium from gaseous streams at its integrated zinc and lead in Trail, British Columbia, Canada. Fumes and other particulates from the lead smelter are transferred to the zinc facilities for hydrometallurgical separation and from there to the high-purity indium plant. Fumes generally contain only 0.05–0.2% In or Ge. The plants then leach the fumes to extract In and Ge into solution (along with Zn and Cd) to separate them from the lead sulfate residue. After a first leaching, slurry is settled to remove a lead oxide residue which is pumped back into the lead smelter, and the clear solution is passed on to a second leach. There, the slurry is partially neutralized with direct fume addition and ferric iron to precipitate germanium, indium, arsenic and antimony. This precipitate is the feed for the indium/ germanium recovery plant. The residues from the oxide leaching plant second leach are re-leached with sulfuric acid to dissolve the contained germanium and indium. After filtration, the clear solution is processed in a solvent extraction (SX) unit where both metals are recovered and subsequently reprecipitated to a product for further purification...
Two graphics from Renewable and Sustainable Energy Reviews 13 (2009) 493–517):

The caption:

The caption:
I'm sure all of these pyrometallurgical retorts in Canada will do just fine, powered by the wind, perhaps with compressed air storage, or maybe not.
Nevertheless, even with some knowledge of the steel requirements for wind turbines, the aluminum requirements for wind turbines I will buy the 10-25 g/kWh for CO2 for wind energy, and include solar energy along with it [b]at least when they operate. The elephant on the table is that these forms of energy require back up, and an honest appraisal would assess the economic and environmental costs of back up and include it in their real costs .
My opinion is that there is very little honesty among those who have bet the atmosphere on this cockamamie scheme that was abandoned close to 200 years ago, making energy dependent on the weather, but again, that's my opinion, and one is free to question whether I know as much as someone who, for example, cruises university press releases to announce "breakthroughs" that assure us that it was the right thing to bet the planet, and much of the life on it, on the success of so called "renewable energy."
Now let's return to the original paper cited at the outset here which discusses the added costs in CO2 and money for storage of energy using batteries.
In the following graphics showing the results of the battery analysis, note that the units on the ordinate for carbon dioxide are in kg/kWh and need to be multiplied by 1000 to convert to [grams/kWh as cited above and in many other LCA papers.
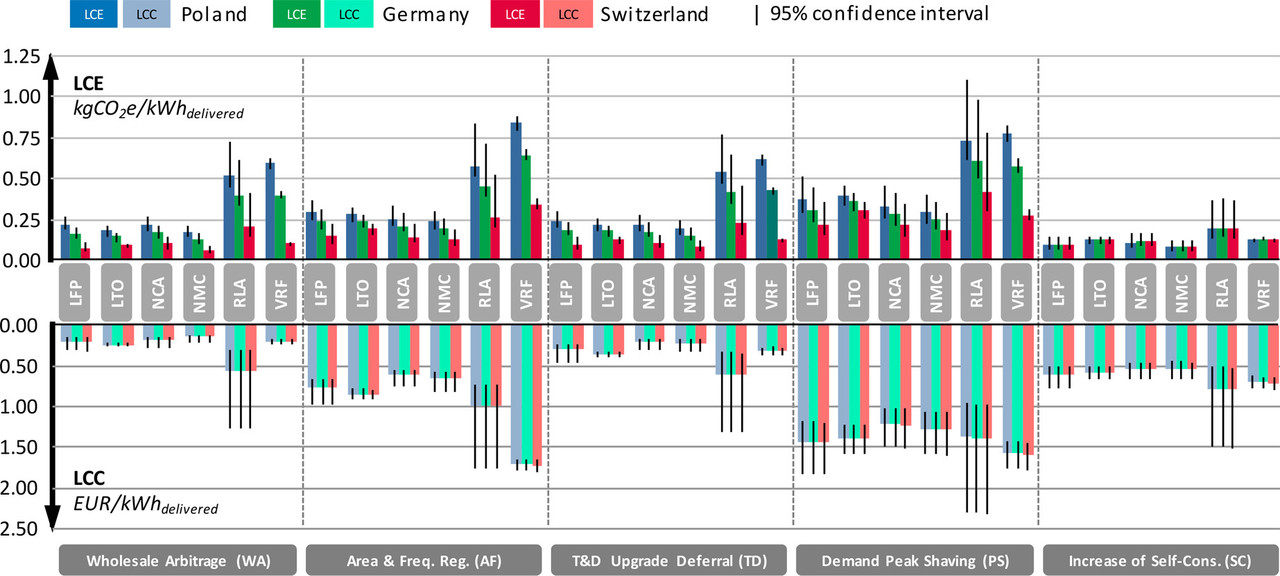
The caption:
In all usage cases, the lithium based batteries perform better than the lead based batteries and the vanadium based batteries; in Poland these two types of batteries is some use cases make the carbon dioxide cost actually greater than burning dangerous natural gas, and even approaching the case of coal. On the other hand in the arbitrage case in Switzerland, the "buy low, sell high" strategy - storing energy purchased at low busbar prices to sell it when busbar prices are high shows the best performance over all for carbon dioxide in Switzerland, nearly approaching the low carbon cost of nuclear plants, especially if one is willing to ignore the subsidy paid by slave laborers digging cobalt in the "Democratic" "Republic" of the Congo for three of the four lithium battery types.
I shouldn't, I know, keep dragging this slave labor thing into it all - Elon Musk is a hero - but well, I can't help it you see, because it bothers me just a little. Slave laborers in the "Democratic" "Republic" of the Congo aren't "green" like us; they're black. The Half Has Never Been Told.
All of the slave subsidized batteries perform pretty well in all scenarios, ranging (in exactly one case, in Switzerland for arbitrage, and in nearly all cases for the SC, "off grid" cases) from nearly nuclear equivalent to "only" 15X (1500% in "percent talk" ) higher than nuclear for carbon emissions, at least if one only looks at the batteries and not the intrinsic costs of the wind turbines and solar cells themselves. In the latter case, if one does include these costs, then they're only twice as high as nuclear.
To evaluate the consumer cost, whether the consumer is a large scale utility or some "off grid" homeowner, one should note that as of this writing, the Euro is worth about $1.12, and that US Electricity Prices, as of March 29, 2019, range from 8.8 cents per kWh in Oklahoma "where the wind comes sweeping down the plains" to 32.09 cents/kWh in Hawaii with the US average being 12.47 cents/kWh or 13.96 euro cents/kwh.
For the arbitrage people this doesn't matter, since they're buying electricity when it's cheaper than average, and selling it when it's higher than average. The "off grid" people are paying more than 300% more than US consumers, but they're very noble, at least if you don't count the slave labor subsidy, which I should stop bringing up, except "The Half Has Never Been Told."
This is probably the graphic that needed the most attention, I think, since it says the most. This is into what we are sinking the future of the world, and even if it's not working and won't work, well either read it and weep, or cheer, it matters not.
The breakdown of cost of manufacturing batteries in emissions only, slaves and resource depletion notwithstanding, and the losses of energy to the second law of thermodynamics:
The caption:
Component based and process based carbon dioxide costs:
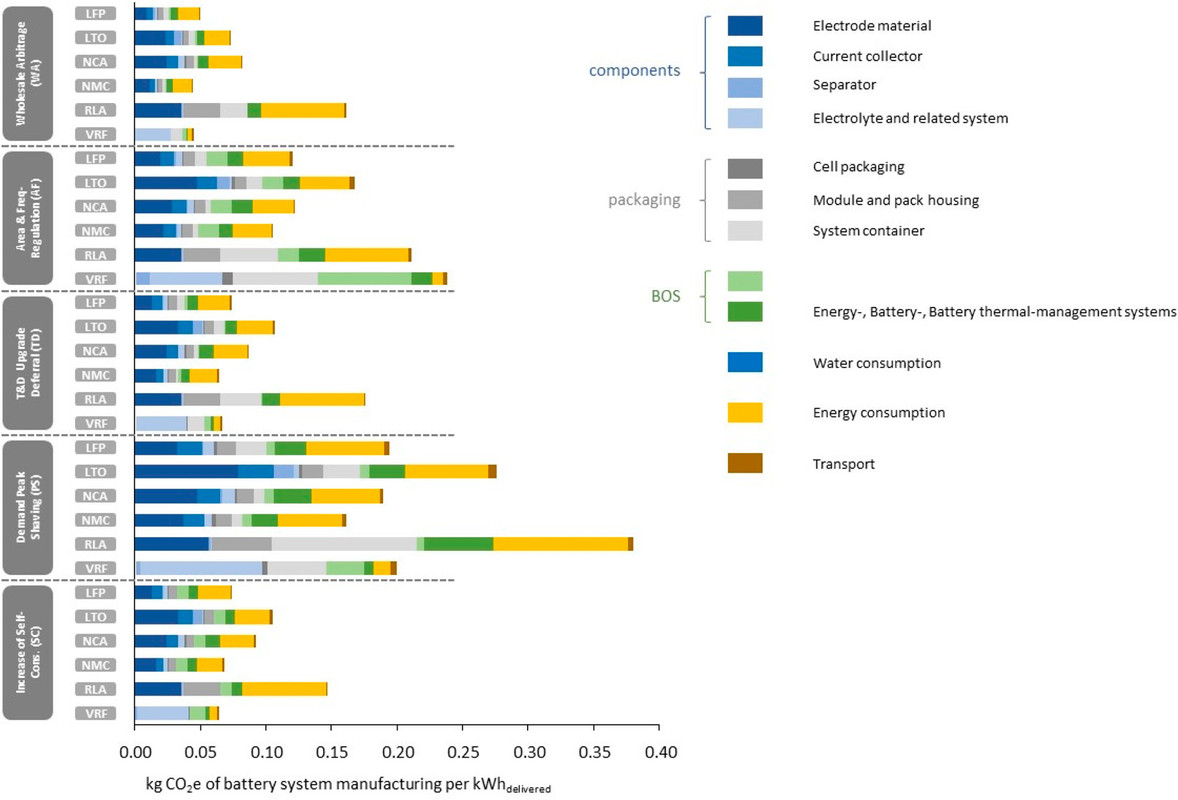
The caption:
A graphic designed as a summary.

The caption:
Don't worry, be happy. Even though batteries suck, we can always read press releases about how batteries can someday be better and put our hope in hope.
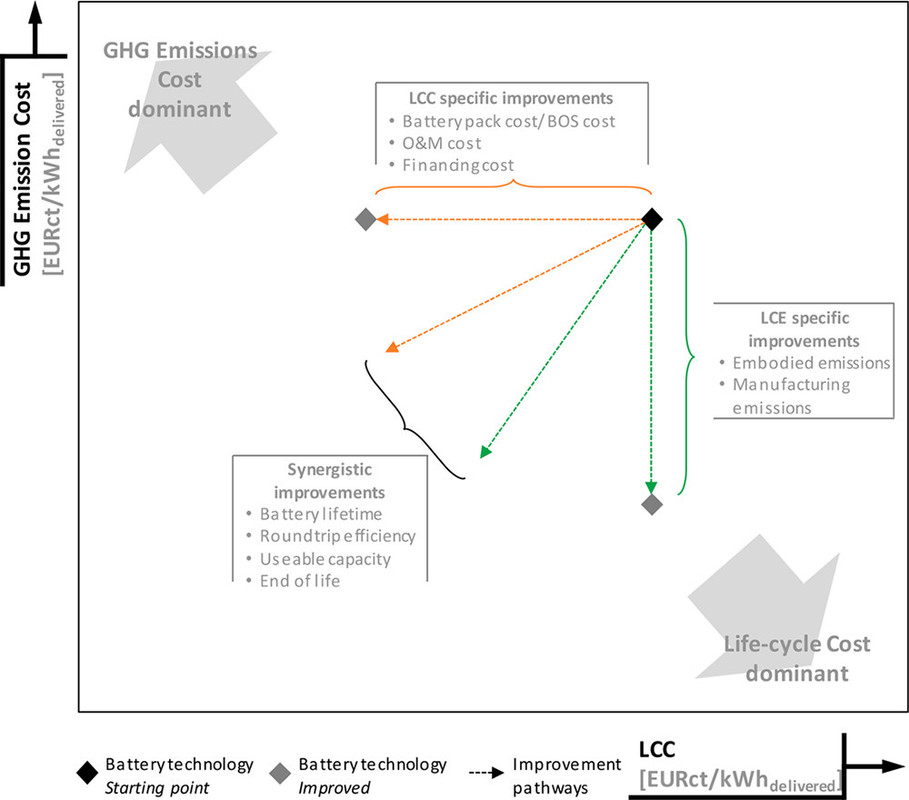
The caption:
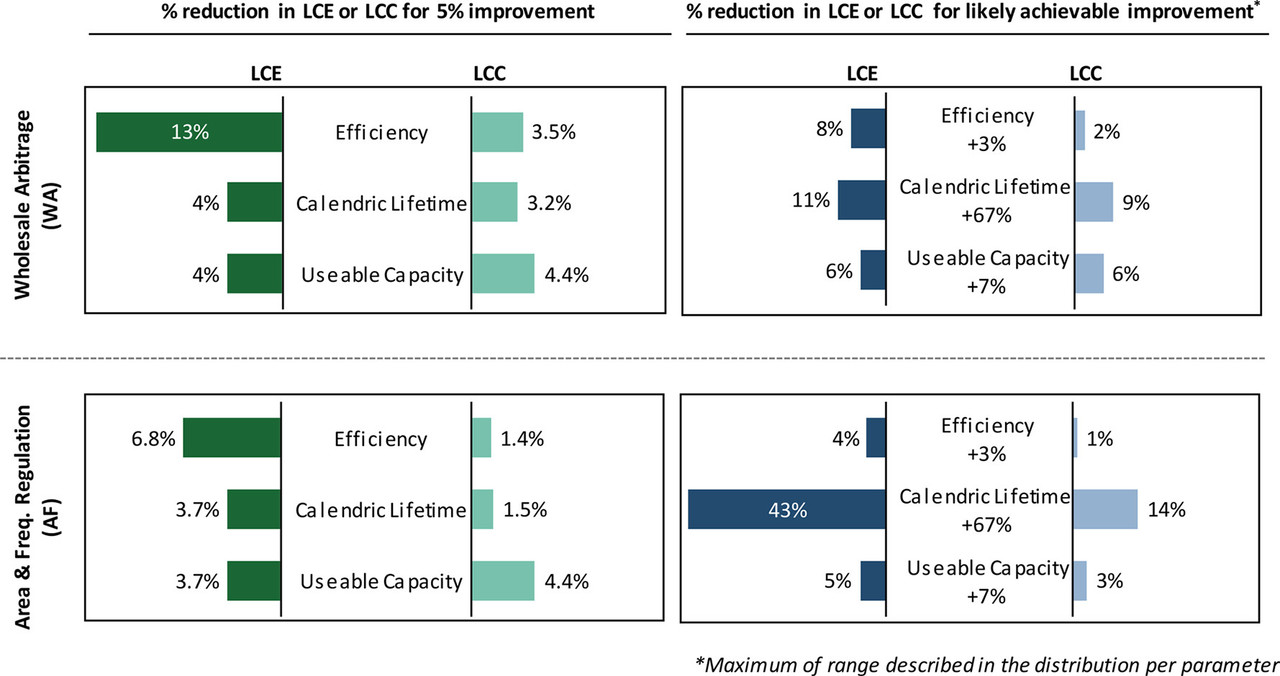
Where the authors think we should focus our efforts in the "don't worry, be happy" case to realize these improvements, even though climate change is here and now:
The caption:
From the author's conclusions:
I have bolded what the authors concede they have not discussed about our dreams of that grand renewable nirvana we burn gas and coal to praise so loudly and so often. They also didn't mention moral costs, but that's OK, I did, I couldn't help myself. The Half Has Never Been Told.
Above I remarked that it's quite possible that no one will read what I say, and fewer will care. The value of writing this long post was, for me, to clarify my thinking. Clear thinking can make one weep.
I hope you've had a pleasant weekend thus far, and will have a pleasant Sunday evening.
Quantitative Study of Straw Bio-oil Hydrodeoxygenation over a Sulfided Ni Mo Catalyst
The paper I'll discuss in this post is this one: Quantitative Study of Straw Bio-oil Hydrodeoxygenation over a Sulfided NiMo Catalyst (Miloš Auersvald*† , Bogdan Shumeiko†, Martin Staš† , David Kubička† , Josef Chudoba‡, and Pavel Šimáček†, ACS Sustainable Chem. Eng., 2019, 7 (7), pp 7080–7093)
Recently in this space I noted the preparation of a carbon dioxide capture agent, a porous form of magnesium carbonate impregnated with PEI (Polyethylimine) that involved the use (in preparation) of the dangerous fossil fuel derived solvent toluene.
I often argue that petroleum mining, which irrespective of how the "peak oil" hullabaloo turned out in the short run turned out, is unacceptable. As far as motor fuels - to the extent we really want them - are concerned, it is (to my mind) a no-brainer. Gasoline is neither a safe nor clean fuel, but clean fuels are available, notably the wonder fuel dimethyl ether, which can effectively displace all of the world's diesel, gasoline, LPG, and dangerous natural gas wherever they are subject to combustion in heat engines of various types.
The question of replacement of petroleum for chemical feed stocks is a little more problematic, although syn gas can easily displace most aliphatic molecules. The pathway for most of these is seems pretty clear to me from memory.
Aromatic compounds, benzene and its related compounds, at least those lacking oxygen substituents are a little bit more problematic for me. I know routes exist to make them from biomass, but they for some reason don't stick in my mind. It's why this paper caught my eye in my general reading.
From the introductory text:
A bio-oil is a complex mixture of hundreds to thousands of oxygenates.(5) Together with the fact that its chemical composition is strongly dependent on the original biomass,(2) this makes a detailed quantitative characterization very difficult and time-consuming. Probably, for this reason, some papers studying bio-oil hydrodeoxygenation (HDO) only focused on the characterization of the physicochemical properties of the HDO products.(6?8) To simplify the determination of the bio-oil composition, some researchers used the percentage of the total peak area obtained from GC-MS to estimate the content of the individual chemical compounds.(4,9?11) However, such an approach can be misleading due to the different response factors of the different oxygenates.
To our best knowledge, just three papers focused on the detailed quantification of the chemical changes occurring during the bio-oil HDO.(12?14) Routary et al.(12) used GC-FID and HPLC-RI to quantify oxygenates and a special GC-MS technique (nitric oxide ionization spectroscopy evaluation) to quantify the hydrocarbons formed. Sanna et al.(14) used GC-MS for the quantification of 28 different compounds and HPLC for the quantification of saccharides. Nevertheless, the most detailed study up to now was apparently carried out by Stankovikj et al.(13) from the National Renewable Energy Laboratory (NREL)...
...In our previous paper, we tested a sulfided NiMo/Al2O3 catalyst for the HDO of a straw bio-oil (as an alternative to the wood bio-oil generally used) from the ablative fast pyrolysis and analyzed the physicochemical properties of the resulting HDO products.(25) To provide a deeper understanding of the whole straw bio-oil HDO process over the sulfided catalysts, we have built upon our previous work and present what, to our best knowledge, is the first such detailed quantitative study of this process including analysis of both the aqueous and organic phases formed. Low-molecular compounds were quantified by GC-MS, 115 of them were quantified directly and the other more than 100 indirectly. The total concentrations of the carboxylic acids, carbonyls and phenols were quantified by the carboxylic acid number (CAN), Faix, and Folin–Ciocalteu methods, respectively. Thanks to the detailed analysis of the volatile compounds, we were able to consider the reactivity of the respective groups in the nonvolatile fractions of the samples...
The authors utilize GC/MS (gas chromatography with mass spec detection) to understand the catalytic approach they are performing.
Bio oils (and lignins, the non-cellulose portion of wood and straw) typically contain large amounts of phenols and polyphenolic compounds, aromatic compounds having -OH groups attached to them. These are subject to oxidation and side reactions which limit the amount of time that they can be utilized as fuels (or solvents) and also result in corrosion of metal and other surfaces.
Some quick pictures from the paper:
Lignin bio-oil composition:

The caption:
The authors then treat the bio-oil with a nickel molybdenum catalyst as follows:
Results:

The caption:
Chemical pathways:

The caption:

The caption:

The caption:

The caption:
Some more reaction pathways:

The caption:

The caption:

The next several graphs refer to chemical speciation. It is important to note that crude oil is also highly speciated before refining and processing.
The caption:

The caption:
The caption:
From the conclusion:
Note that I am personally not interested in gasoline or jet-fuels, but these nasty fuels do contain valuable chemicals.
To the extent that such chemicals are utilized to make materials, and to the extent to which these chemicals are obtained from biomass, they are sequestered from the atmosphere.
We need to pay attention to such things, or at least the future generations we have screwed will need to do so.
The heat for these reactions is available from nuclear energy, which, as I state often, is the only sustainable form of primary energy available in time to save what is left to be saved.
Have a pleasant evening.
Profile Information
Gender: MaleCurrent location: New Jersey
Member since: 2002
Number of posts: 33,512