NNadir
NNadir's JournalNature (News): The Reality Behind Perovskite Solar Cells.
The news item I'll discuss in this post comes from one of the world's most prominent scientific journals Nature. I believe it's open sourced. It's this one: The reality behind solar power’s next star material (Nature 570, 429-432 (2019))
Some excerpts:
...More than a dozen companies worldwide (see ‘Solar hopes’), a mixture of established electronics giants and start-ups, are hoping soon to sell panels made with perovskites. Dozens more are involved in making materials for the products, says Margareth Gagliardi, an analyst with BCC Research in Wellesley, Massachusetts.
For decades, slabs of crystalline silicon have dominated the solar industry. Other materials that can be layered in thin films, such as copper indium gallium selenide (CIGS) and cadmium telluride (CdTe), have captured less than 5% of the market, because it’s hard to make them as efficient or cheap as conventional solar panels. Perovskites could be a different story. They should be cheaper to make and seem impressively efficient at converting sunlight into electricity — in the laboratory, at least.
Wow. For decades...
Often over the last ten years since I went from enthusiasm for the solar industry to hostility, as I've remarked on the failure of the solar industry to do anything to address climate change after half a century of wild cheering for it, one of the more common explanations (excuses?) is that it's a "new industry."
It's a "new industry" that has soaked up over a trillion dollars (with another more than a trillion on wind) in the last ten years.
Frankfurt School/UNEP Global Renewable Energy Investment, 2018, Figure 3, page 14
Further excerpts:
If...if...if...
I can't say how many "ifs" I have heard about solar energy since 1970 (when I was a kid), soon to be 50 years ago.
Actually we have put all of our "eggs in one basket" in addressing - or put more properly pretending to address climate change: So called "renewable energy."
I note, with tremendous sadness at the edification of fear and ignorance, that many of the people who have bet the planetary atmosphere on so called "renewable energy" are more opposed to nuclear energy than to dangerous fossil fuels, even though dangerous fossil fuel waste, along with biomass combustion waste is responsible for 7 million deaths per year, and so called "nuclear waste," um, isn't.
Here is the most recent full report from the Global Burden of Disease Report, a survey of all causes of death and disability from environmental and lifestyle risks: Global, regional, and national comparative risk assessment of 79 behavioural, environmental and occupational, and metabolic risks or clusters of risks, 1990–2015: a systematic analysis for the Global Burden of Disease Study 2015 (Lancet 2016; 388: 1659–724) One can easily locate in this open sourced document compiled by an international consortium of medical and scientific professionals how many people die from causes related to air pollution, particulates, ozone, etc.
The note about lead being in these solar cells of course doesn't matter, or course, anymore than cadmium or tellurium mattered since no amount of toxic material being distributed by the solar industry can matter since solar cells are always "green," as we often hear in all kinds of advertisements about being "green."
Except they aren't. The last major distributed energy scheme involving lead was tetraethyl lead in gasoline, in the world's most successful "distributed energy" technology, the automobile. Up until the present day, whenever the chaparral in California blazes, some of that historically deposited lead is volatilized.
Now we want to distribute more lead. Good idea!
A picture from the article.
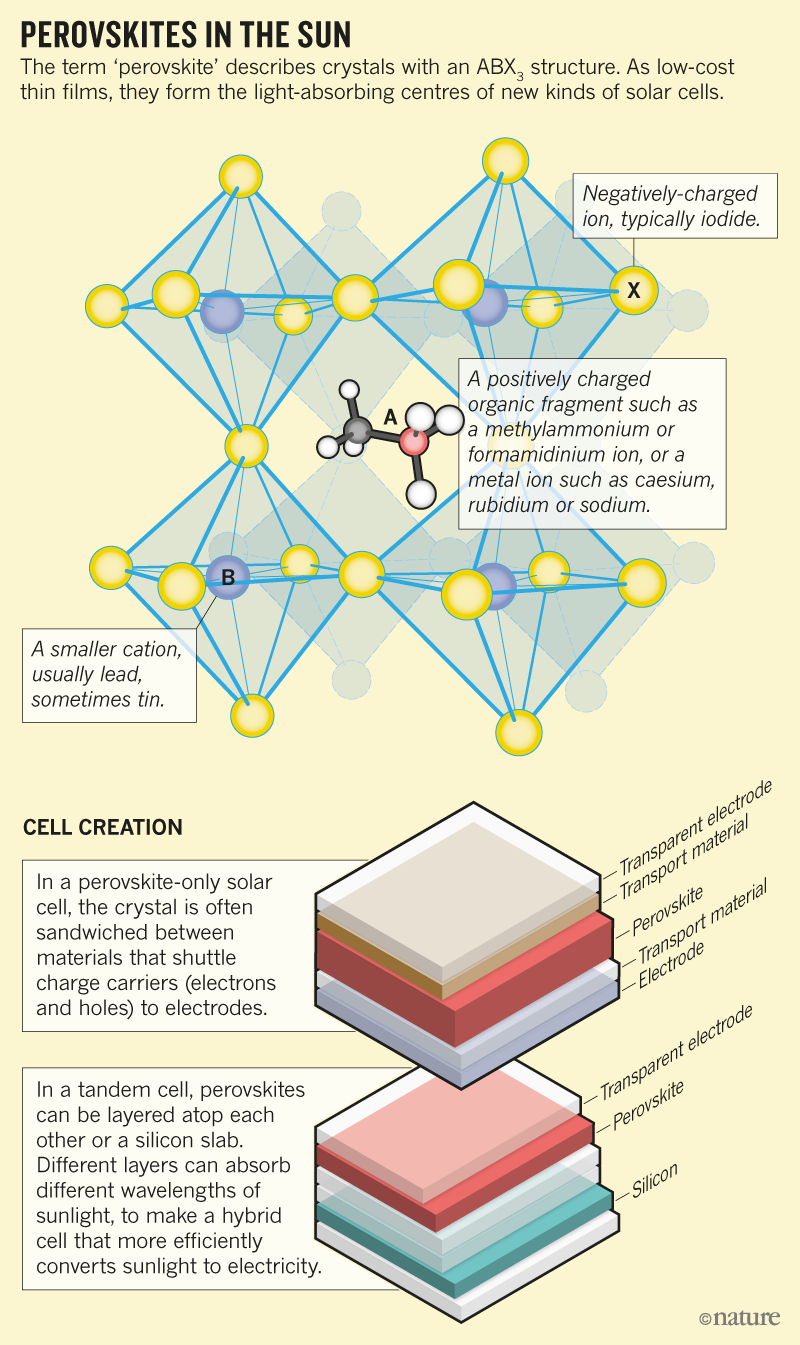
One may also question how "renewable" cesium is, and for that matter, iodine, but no matter...
No matter...
No matter...
More:
The major challenge for perovskites, however, is whether they can last as long as silicon panels, which generally come with a 25-year warranty. Perovskite stability “needs to approach the norms established by silicon” and that is “now looking increasingly unlikely”, says Martin Green, who researches perovskites and other solar materials at the University of New South Wales in Sydney, Australia. His team collaborates on the materials with two large Chinese solar-panel makers, Trina Solar and Suntech...
...Perovskites are sensitive to air and moisture, but that shouldn’t be a killer problem. Commercial solar panels already encapsulate their photovoltaic materials in plastic and glass for protection...
...A deeper issue lies in the crystals themselves. In some cases, the structures shift as the perovskites warm up; the change is reversible, but it affects performance...
Ummmm... plastic...eating it is good for you, and be sure you are eating it, pretty much every damned day, a little more won't hurt you.
And the argument is made that a little more lead won't hurt you, since possibly lead based solar cells are even greener than silicon solar cells:
Another potential stumbling block for perovskite cells is that the best of them contain lead, a toxic metal. Researchers have tried alternatives, such as tin, but performance declines. That doesn’t mean the cells can’t be used. A life-cycle analysis of Oxford PV’s tandem cells suggests that the small amount of lead they contain wouldn’t have much impact on environmental toxicity if it leaked. The analysis also argues that silicon cells have a worse overall environmental impact because of the resources used in their production.
Whiny people disagree:
We can, of course, compromise on anything declared in the popular imagination, if not reality, to be "green."
The result of the bet of the planetary atmosphere on so called "renewable energy" has been reported by the International Energy Agency:
In this century, world energy demand grew by 164.83 exajoules to 584.95 exajoules.
In this century, world gas demand grew by 43.38 exajoules to 130.08 exajoules.
In this century, the use of petroleum grew by 32.03 exajoules to 185.68 exajoules.
In this century, the use of coal grew by 60.25 exajoules to 157.01 exajoules.
In this century, the solar, wind, geothermal, and tidal energy on which people so cheerfully have bet the entire planetary atmosphere, stealing the future from all future generations, grew by 8.12 exajoules to 10.63 exajoules.
10.63 exajoules is under 2% of the world energy demand.
2018 Edition of the World Energy Outlook Table 1.1 Page 38 (I have converted MTOE in the original table to the SI unit exajoules in this text.)
But the most telling result of this bet is written in the planetary atmosphere. From this week's data from the Mauna Loa Carbon Dioxide Observatory:
Up-to-date weekly average CO2 at Mauna Loa
Week beginning on June 23, 2019: 413.35 ppm
Weekly value from 1 year ago: 410.73 ppm
Weekly value from 10 years ago: 388.54 ppm
Last updated: July 1, 2019
If the fact that the carbon dioxide concentrations are 24.81 ppm higher than they were ten years ago troubles you, don't worry, be happy.
It's not your problem; it's a problem for babies, since it is they and not us, who will have to live up to all that "by 2030" and "by 2050" bullshit that they've been handing out at the anti-nuke ignorance squad at Greenpeace ever since 1970 when, of course, it was "by 2020," but no matter...
No matter...no matter...
Elon Musk. Tesla electric car. Plastic and steel wind turbines in the benthic ecosystem off New Jersey. Solar thermal. Solar house. Solar roof. Happy. Happy. Be happy. Be nice.
Don't worry...be happy...
No one now living, Bill McKibben and his Prius be damned, will ever see a reading at Mauna Loa of below 400 ppm of the dangerous fossil fuel waste carbon dioxide in the planetary atmosphere again.
History will not forgive us, nor should it.
Have a nice evening.
I'm so happy. My kid's reactions are all failing in the lab.
I got to discuss all kinds of science with him, and offer suggestions and exchange references, not just father to son but scientist to scientist.
It's one of the best phone calls of my life; my kid's learning how to do research, for real...
I kind of lived for this day.
Vacancy-Doped Neodymium Telluride for Thermoelectric Applications
The paper I'll discuss in this post is this one: Synthesis and Characterization of Vacancy-Doped Neodymium Telluride for Thermoelectric Applications (Bux et al, Chem. Mater. 2019, 31, 12, 4460-4468)
Recently, according to my son who is interning there, the Oak Ridge National Lab resumed the production of plutonium-238, the isotope that has powered many interplanetary space missions, the most famous recent example being the wonderful New Horizons mission that visited the Pluto/Charon systems (Plutonium is named for Pluto, which was as the time of the discovery of the element, considered a planet) as well as the Ultima Thule Kuiper belt object.
The plutonium-238 RTG's have functioned beautifully, some for multiple decades.
The introduction to the paper discusses one such mission, the Voyager mission, still growing strong, but describes its limitations:
Because of the limitations of the editor at DU for mathematics, let me post graphic equations for the dimensionless figure of merit from another paper (Synder and Synder, Figure of merit ZT of a thermoelectric device defined from materials properties, Energy Environ. Sci., 2017,10, 2280-2283 :
where S is the Seebeck coefficient, ? is the electrical resistivity, ? is the thermal conductivity and T is the absolute temperature of the material at the point in question.5 The figure of merit zT(T) is, in general, a temperature dependent material property derived from temperature dependent material properties S(T ), ?
 T), and ? (T). An efficient thermoelectric generator, however, must operate across a finite temperature difference ?T = Th ? Tc so that these material properties will change from the hot to the cold end.

The maximum efficiency ? of a thermoelectric generation device is also traditionally characterized by the thermoelectric device figure of merit, ZT whereimage file: c7ee02007d-t4.tif (2) The overall maximum efficiency of the generator is limited by the Carnot factor, ?T/Th, and the reduced efficiency that depends on ZT, Th and Tc. Eqn (2) is typically derived assuming the thermoelectric materials properties S, ?, and ? are constant with respect to temperature, exactly matched n-type and p-type legs and 1-dimensional heat flow with no other losses.2 It is only in this case of constant S, ?, and ? that the material figure of merit zT (at T = (Th + Tc)/2) and the device figure of merit ZT (evaluated between Th and Tc) are the same.
"zT" here is not a product, but is rather a traditional representational symbol of "figure of merit."
As is the case with straight up Carnot efficiency, it can be seen here that the distance between the high temperature and low temperature dictates the efficiency of the system. Therefore thermoelectric systems that work at high temperatures are to be preferred.
A table from the Synder paper gives a feel for the relationship between efficiency and the figure of merit:
Returning to the original paper under discussion, the authors have worked with a new material, neodymium telluride, to achieve relatively high Seeback coefficients.
The material is being compared to and designed around another lanthanide telluride, lanthanum telluride. This material has a figure of merit of 1.1 at 1275K.
Some technical talk around this topic:
Some pictures from the text:


Concluding comments from the paper:
Right now, the Pu-238 radioisotope fuel is precious, although it occurs to me that there might be a better way to make it than the traditional approaches, involving fluid phase fuels.
I personally have convinced myself that the only way to clean up the increasingly destroyed atmosphere (and many other intractable environmental problems) is via very high temperature nuclear reactors, reactors operating at temperatures high enough to split either water into hydrogen and oxygen (via thermochemical cycles) or carbon dioxide into carbon monoxide and oxygen. Many such cycles are known.
There are many approaches to recovering energy and raising efficiency of high temperature devices, including combined cycle approaches using Brayton/Rankine/Stirling cycles in tandem, or perhaps, thermoelectric devices such as are described here.
A note on tellurium: I'm quite sure that somewhere, maybe here, I have ridiculed cadmium telluride solar cells, noting that tellurium, besides its toxicity, is a critical element that is not really "renewable" but easily subject to depletion.
Tellurium is a fission product, and in fact, it has some materials science problems associated with it. Here for instance is one example, described in a recent publication of a class of nuclear reactors known as "molten salt reactors" (MSRs):
Chalcogens all exhibit a high electron affinity, being members of Group 16, and Te is third highest in the column at 190kJ-mol~^ (1.96 eV). The ground-state electronic configurationsfor oxygen and tellurium (O = Is, 2s2 2p4; Te = [Kr] 4d10 5s2 5p4) both exhibit incomplete p orbitals (np4); a filled p orbital has six electrons. These incomplete p orbitals make chalcogens aggressive oxidizing agents, so as to close that deficit, namely, achieve a closed np* (O, n = 2; Te, n = 5) orbital. For technical reasons beyond the scope of this discussion, sulfur, selenium, and tellurium can adopt higher oxidation states. In the case of tellurium in the MSR experiments conducted at ORNL, Te was found as TeF6, a highly soluble form of a tellurium fluoride with a formal charge of + 6. Early MSRE studies demonstrated the damage that Te inflicted on the inner surfaces of containment materials. In some cases fissures up to 300 pm deep were produced (Houtzeel and Dyer, 1972; McCoy, 1978). In a series of investigations, ORNL researchers examined the effects of TeF6 and TeF6 + F2 exposure to a number of alloys, the most promising of which for use in an MSR (at the time) were Nickel 200 (99 + % pure Ni) and Monel K-500 (67%Ni, 32.x% Cu, balance other metals); Hastelloy was not included in these experiments. Both alloys were tested at approximately 500°C and for varying lengths of time. Both were found to have substantial Te-derived corrosion, both at the surface and intergranularly, although the Monel K-500 less so. One possibility is that, despite the presence of highly oxidizable Ti and Al in the Monel K-500 in a fluorinating environment such as in the molten-salt bath, the intermetallic, gamma prime precipitate (NiaAl/Ti, FCC crystal structure) may assist in corrosion resistance. When these alloys were exposed to TeFg and F2, corrosion rates were reduced. It is possible that this reduction is attributable to F2 being such a strong oxidizer, thereby maintaining TeFg in a fully oxidized, + 6 state.TeFg, the solubilized Te species, was readily reduced when exposed to these and other alloys. In fact, some metallic Te was detected on the Monel coupons, as well as CuTe. When investigated under x-ray crystallography, NiTc2, NiTe and NiF2 were all found in varying amounts on each coupon, supporting typical chalcogenic behavior where a Ch prefers a formal charge of - 2. Cu2-xTe was also found on the Monel K-500, as would potentially have been predicted, given the percent balance that Cu makes as the Monel alloy. Cu2-x may also have been a logical prediction as a mixed system, given Cu’s two oxidation states. This was, in part, because Te, like O, Se, S, all prefer a Ch-2 (Ch = chalcogen) state, to close that p orbital…
...and so on. At ONRL the oxidation in the MSR was controlled by placing reducing agents in the fluid fuel, specifically uranium trifluoride.
(Cf. Thomas Dolan, Ed. Molten Salt Reactors and Thorium Energy, Woodhead Publishing, 2017 pg. 56)
For the record, not that anyone is likely to care, although I was once quite fond of MSR's and still believe that molten salt technologies have potential uses, more in fuel reprocessing than in reactors although some MSR type reactors are better than others, I have changed my mind largely about them and am considering what I regard as better options.
Lanthanum and neodymium in any case are also fission products, and can be recovered from used nuclear fuels as tellurium can be.
The difference here is that solar cells have low capacity utilization - they only operate near their peaks (but seldom, often never, at their quoted peaks) when the sun is up on low cloud days - whereas a thermoelectric device, as is the case on the Voyager and New Horizon missions can operate continuously. Moreover, they can be far more dense in material usage than solar cells, and the risk of toxicity is lower simply because the tellurium is not distributed to the masses, many of whom lack the education to understand the risks of tellurium (and cadmium) or proper routes to disposal.
I note that if the pools containing the spent fuel rods at Fukushima had been empty because the used fuel was contained in thermoelectric devices rather than in water, the reactors would still be operating, even after being swamped with seawater, since the circulating pumps would not have depended on diesel back up generators, but simply on a thermal gradient is a solid state device.
Just saying...
I trust you're having a wonderful evening.
The weekly reading at the Mauna Loa CO2 observatory for June 16, 2019 breaks into 50 worst increases
Each year, the maximal value for carbon dioxide levels in the atmosphere for a particular year is observed in the Northern Hemisphere's spring. The Mauna Loa Observatory reports weekly year to year increases for each week of the current year compared to the same week in the previous year.
This year, in 2019, as is pretty much the case for the entire 21st century, these maxima represent the highest concentrations of carbon dioxide ever recorded going back to 1958, when the Mauna Loa carbon dioxide observatory first went into operation. Weekly data is available on line, however, only going back to the week of May 25, 1975, when the reading was 332.98 ppm.
May 12, 2019 set the all time record for such readings: 415.39 ppm.
These readings, as I often remark vary in a sinusoidal fashion, where the sine wave is imposed on a monotonically increasing more or less linear axis, not exactly linear in the sense that the slope of the line is actually rising slowly while we all wait with unwarranted patience for the bourgeois wind/solar/electric car nirvana that has not come, is not here and will not come.
This graphic from the Mauna Loa website shows this behavior:

The annual minima are generally recorded in the Northern hemisphere's autumn. This year's absolute readings will fall until around September, whereupon they will begin to rise to what is sure to be a new record maximum in 2020.
Somewhat obsessively I keep a spreadsheet of the weekly data, which I use to do calculations to record the dying of our atmosphere, a triumph of fear, dogma and ignorance that did not have to be, but nonetheless is. I note, with sadness and regret, that we are the left are not free of such fear ignorance and dogma, although I wish we were. We cannot, with justice, attribute this outcome to Ronald Reagan, George Bush the first and second, and Donald Trump. We bear responsibility, no matter how much we pat ourselves on the back for our insane worship of so called "renewable energy."
In these spreadsheets, in particular, I record in this spreadsheet the increases over the previous year.
Here is the data for the week ending June 16, 2019:
Week beginning on June 16, 2019: 414.03 ppm
Weekly value from 1 year ago: 410.38 ppm
Weekly value from 10 years ago: 389.20 ppm
As of this writing, there have been 2,264 such weekly readings recorded at Mauna Loa, going back to 1975. The increase is the 47th highest ever recorded among all of these. This places in the top 50 among all such data points, greater than 2.1% of all such readings, in the "percent talk" utilized to generate wishful thinking about this disaster.
With the year just about half over, 8 of the 50 highest year to year weekly average increases ever recorded have been in 2019. Thirty-three of the top 50 such readings have taken place in the last 5 years; 38 in the top 50 recorded in last ten years, and 41 of the top 50 recorded in this century.
The average increases over the last 4 weeks when compared to the same week in 2018 has been 3.17 ppm. For the whole of 2019, these weekly year to year increases have averaged 3.10 ppm.
In the 20th century these figures averaged 1.54 ppm; in the 21st, 2.14 ppm (and rising).
If the fact that this reading is 24.83 ppm higher than it was ten years ago bothers you, don't worry, be happy. You can read all about how wonderful things will be "by 2050" or "by 2100." Wind. Solar. Elon Musk. Tesla Car. And all that.
If you're even a tiny bit troubled, head on over to the E&E forum here and read all about "battery breakthroughs" to store "clean energy" even if this ignores little unimportant trivialities like the 2nd law of thermodynamics, and the fact that making steel for massive wind industrial parks in former pristine wildernesses is neither clean nor, in fact, sustainable.
My impression that I've been hearing all about how rapidly bird and bat grinding wind turbines are being installed since I began writing here in 2002, when the reading on April 21, 2002 was 375.42 ppm should not disturb you, since it is better to think everything is fine rather than focus on reality.
All this jawboning about the wonderful growth of so called "renewable energy" has had no effect on climate change, is having no effect on climate change, and won't have any effect on climate change, but it's not climate change that counts: It's all that wonderful marketing showing pictures giant sleek wind turbines on steel posts that counts.
Don't be angry, be happy and nice. Say nice things. Be pleasant.
If the fact that steel is made by coking coal at high temperatures in coal fired furnaces enters your mind, I suggest you meditate and say, "OM...om...om...om..." until you're only left with happy thoughts.
At the risk of repetitively asserting that reality - as opposed to cheering for our own wishful thinking - matters, though let me say again:
In this century, world energy demand grew by 164.83 exajoules to 584.95 exajoules.
In this century, world gas demand grew by 43.38 exajoules to 130.08 exajoules.
In this century, the use of petroleum grew by 32.03 exajoules to 185.68 exajoules.
In this century, the use of coal grew by 60.25 exajoules to 157.01 exajoules.
In this century, the solar, wind, geothermal, and tidal energy on which people so cheerfully have bet the entire planetary atmosphere, stealing the future from all future generations, grew by 8.12 exajoules to 10.63 exajoules.
10.63 exajoules is under 2% of the world energy demand.
2018 Edition of the World Energy Outlook Table 1.1 Page 38 (I have converted MTOE in the original table to the SI unit exajoules in this text.)
If you think that unlike you, I am worrying and not being happy, you can always chant stuff about how "by 2050" or "by 2075" or "by 2100" future generations will all live in a so called "renewable energy" nirvana powered by the sun and the wind and tooling around in Tesla electric cars.
I'll be dead "by 2050," as will most of the people doing such soothsaying about that magic year, but I'm sure that the future generation living through 2050 will all be cheering for our wonderful insight into the world in which they will be living.
Or maybe not. Maybe they won't forgive us for our wishful thinking by which we casually dumped responsibility on them to do what we were purely incompetent to do ourselves, this while we consumed every last drop of rare elements to live in our bourgeois moral hell.
We will not be forgiven, nor should we be.
I wish you a pleasant work week.
Nature: Trump's plan would make government stupid
This article was published in Nature's opinion and commentary section: Trump’s plan would make government stupid (Dr. Gretchen Goldman, Nature 570, 417 (2019))
This commentary is probably open sourced.
This is not just another of his ill-informed policies, or one that only wonks care about. It is the government making itself stupid. Ignoring, suppressing or manipulating science advice has been a pattern of this administration; now the very committees that provide that advice are being eliminated.
Scientists must sound the alarm...
...The committees now under threat also help the public to hold decision-makers accountable when they ignore important evidence. In 2008, the administration of George W. Bush — and in 2011, that of Barack Obama — failed to set a standard for ambient levels of ozone (an air pollutant that causes respiratory and cardiovascular distress) that the seven-member Clean Air Scientific Advisory Committee recommended. The recommendation enabled the public to challenge the administrations’ decisions. Without an advisory committee, the lines between science assessments and policy decisions are blurred.
The executive order is ostensibly a cost-cutting measure. But federal advisory committees are a bargain for taxpayers. Agency staff run a few meetings a year, alongside other duties, and some compensation is granted for economy-class travel and other expenses that committee members incur. According to the US Federal Advisory Committee Act Database, the Clean Air Scientific Advisory Committee spent US$951,860 in 2018, of which only $110,540 went to direct committee costs. (The rest went to existing staff members, who would have been paid anyway.) Thousands of world-class specialists donate their time to help the government to make informed decisions.
Also, every meeting of an advisory committee solicits public comments. This gives community advocates and people without easy access to government officials a way to make their views known. The upcoming cull will give the public less opportunity for input...
...Our analysis found that, in the first year of the Trump administration, federal science advisory committees met less frequently than in any of the 21 years since the government started tracking them. Nearly two-thirds of these committees met less often than their charters direct. We have also logged more than 100 attacks on the use and communication of science in the Trump administration so far, more than for any other president. These include avoiding or removing terms such as ‘climate change’, halting a study by the US National Academy of Sciences and reversing a decision to ban a pesticide linked to neurological conditions in children...
...James Madison, the fourth president and a founding father of the United States, wrote, “Knowledge will forever govern ignorance; And a people who mean to be their own Governors, must arm themselves with the power which knowledge gives.” We owe it to ourselves and our expertise, to the United States and the many other nations affected by its decisions — on emissions, infectious agents, drugs and so much more — to insist on being governed by knowledge, not ignorance. Speaking up for science panels is speaking up for democracy...
I should note that I personally abhor the organization for which Dr. Goldman works, the Union of Concerned Scientists. Usually, when naming the organization I put the word Scientists in quotes, but haven't here, since Dr. Goldman is a scientist, an atmospheric scientist. I would imagine that she successfully compartmentalizes, since that part of her organization led by Dr. Ed Lyman has done more to make air pollution the killer it is by elevating his highly and obviously flawed and frankly paranoid claims about what could happen well over the reality of what is happening, to my lungs, your lungs, and in fact the lungs of every living thing on Earth.
However, to avoid the logical fallacy of "poisoning the well" aka ad hominem, I must state that when a member of that organization states truths, they are truths, irrespective of the platform from which they arise.
As much as I personally despise Ed Lyman, his colleague here, Dr. Goldman, has made an important and valid point, and I applaud it.
The scientific advisory boards cost far less than the bill for Trump's opportunities to cheat at golf.
I trust you'll have a nice weekend.
Recovering Energy from Acid Base Neutralization Via Electrochemical Cells.
The paper I'll discuss in this thread is this one: Reverse Electrodialysis Chemical Cell for Energy Harvesting from Controlled Acid–Base Neutralization (Ying Mei, Lei Liu, Yi-Chun Lua and Chuyang Y. Tang*, Environ. Sci. Technol. 2019, 53, 4640?4647)
I have often argued in this space (including E&E, when I was writing there) that the inattention to the reality of climate change means that the future generations we have screwed with said inattention will need to clean up our waste, most notably the dangerous fossil fuel waste carbon dioxide.
This dangerous fossil fuel waste not only represents the chemical carbon dioxide, but also represents waste entropy, making the engineering and energy requirements of doing so enormous, but I think, thankfully, just at the edge of technical feasibility.
Since the mass per volume of carbon dioxide is higher in seawater than it is in air, mostly in the form of carbonates, the most expedient way of dealing with the entropy we've dumped on future generations is via seawater.
An intriguing, if still relatively obscure technology is the technology developed by Heather Willauer, which is basically an electrochemical cell that through the use of an ion selective membrane splits seawater into an acidic fraction and basic fraction; the acidic fraction releases carbon dioxide which can be hydrogenated to make fuels, while the basic fraction is available for electrolysis to produce hydrogen for the hydrogenation.
It is also notable that the basic fraction is an excellent medium for extracting carbon dioxide from the air, and indeed, many air capture proposals are based exactly on this idea of alkaline solution capture.
The paper under consideration raises the possibility of recovering energy from this process. This is not a perpetual motion machine, by the way, the 2nd law of thermodynamics requires an energy loss. However, the recovery of energy allows for higher efficiency and in the case where the energy provided is nuclear energy, it represents a clean up of the atmosphere and the acidified oceans. Our generation is too stupid to do this, but it has been my pleasure to meet young people with the smarts to do this sort of thing.
When, at the end of these processes, the two fractions are recombined, i.e. neutralized, more carbon dioxide can be released in a pure form suitable for hydrogenation or the manufacture of defacto sequestering agents like refractory carbides of various types, long term use polymers, and carbon products.
This brings me to the paper under discussion.
From the introduction to the paper:
Major developments have occurred in recent years, extending RED applications far beyond the simple mixing of freshwater with seawater. For example, Logan and co-workers formulated the concept of RED osmotic heat engine.(30?33) In this novel approach, a low-grade heat is used to generate extremely high salinity gradients (e.g., with a salinity ratio of ?800 using ammonia bicarbonate solutions), which can be converted into electricity in a subsequent RED step.(31?34) Compared to conventional RED based on freshwater/seawater mixing, the high salinity gradients engineered in such osmotic heat engines translate into significantly enhanced power generation.(30,31) Similarly, the hybridization of RED and bioelectrochemical process can be used to oxidize organic matter in wastewater, which produces more electricity at improved efficiency due to the simultaneous recovery of SGE and bioenergy of biomass and the reduction of overpotential at the electrodes.(30,31,35,36) Many additional promising alternatives have been reported in recent years, such as concentration flow cells(37?39) and reverse osmosis-RED hybridization.(40?44)
An interesting opportunity exists for coupling RED with controlled chemical reactions for enhanced energy production. For example, industrial wastewaters often contain large quantities of waste acid/base, and their controlled mixing in an RED process has the potential to greatly enhance the power generation. Conceptually, one can arrange the acid solution and the base solution in an alternative manner, separated by a compartment for neutralization (Figure 1). The neutralization reaction of H+ and OH– greatly reduces their concentration in this compartment (), leading to additional salinity gradient caused by these ions. The total voltage is then contributed by the H+ and OH– gradients, in addition to the Na+ and Cl– gradients due to Na+ from NaOH and Cl– from HCl, respectively (eq 1):

where N represents the number of the repeating units, ? indicates the permselectivity of IEMs, R is gas constant (8.314 J/mol·K), T indicates the absolute temperature (e.g., 298 K in this study), z refers to the charge of the salt ions (e.g., z = 1 for Na+ and Cl–), F is Faraday constant (96 485 C/mol), a is the activity of a solution with the subscript AS, BS, and NS indicating acid, base, and neutral solutions, respectively. According to eq 1, the total energy production in an RED neutralization cell originates from two driving forces: the contribution from salt ions such as Na+ and Cl– in a similar fashion to a conventional RED process, and that from salinity gradients of H+ and OH–.
In the current study, we demonstrate the feasibility of reaction-enhanced RED process using controlled neutralization of HCl and NaOH. We systematically investigated the critical factors governing the performance of the RED chemical cell. The mechanistic insights of the effects of salt ions uphill transport on power generation were gained in this study. These findings have important implications to the incorporation of chemical reaction with RED for enhanced power production.
Some pictures:


Air sparging can be utilized to raise the voltage of the cell, air sparging (of the basic fraction) will also capture carbon dioxide.

It is worth noting that either desalination, which may become increasingly necessary in places owing to the destruction of the planetary atmosphere, and/or, alkaline electrolysis produce higher concentration salt/base solutions, relevant to the following graphic:


The authors state the following implications:
I apologize for throwing this post together sloppily and quickly, but I have a lot on my plate today. I found this little bit interesting, particularly in consideration of the Willauer technology.
There is hope for the future and future generations to recover from what we have done to them so gracelessly.
I hope you're enjoying your weekend.
Social Scientists Convene to Explore the Relationship Between Armed Conflict and Climate Change.
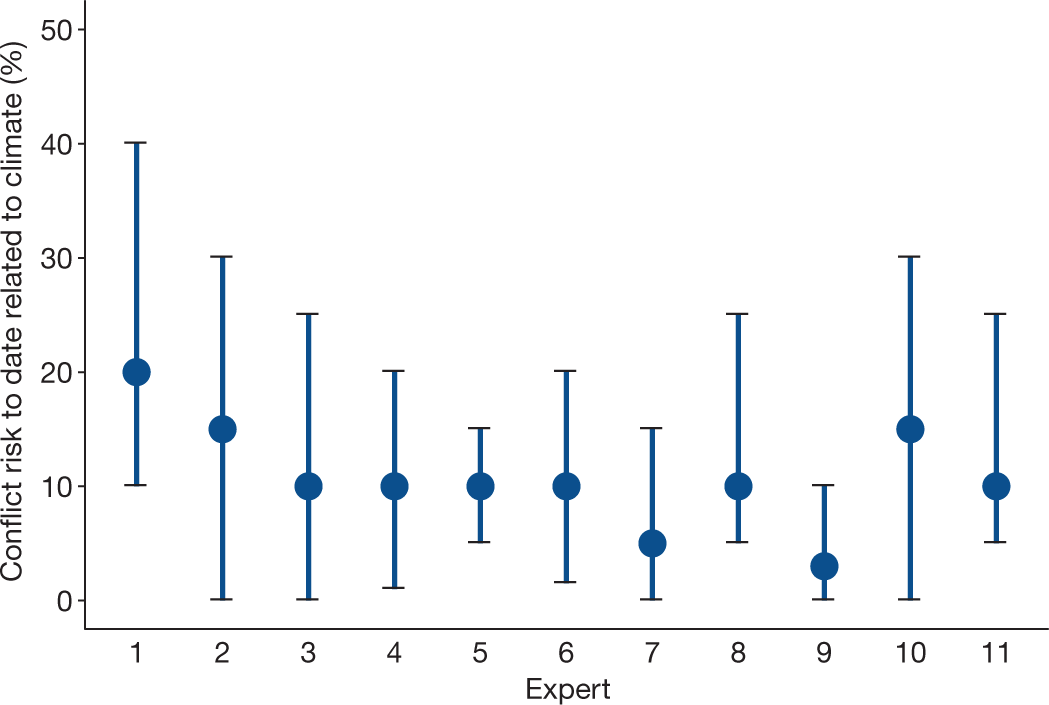
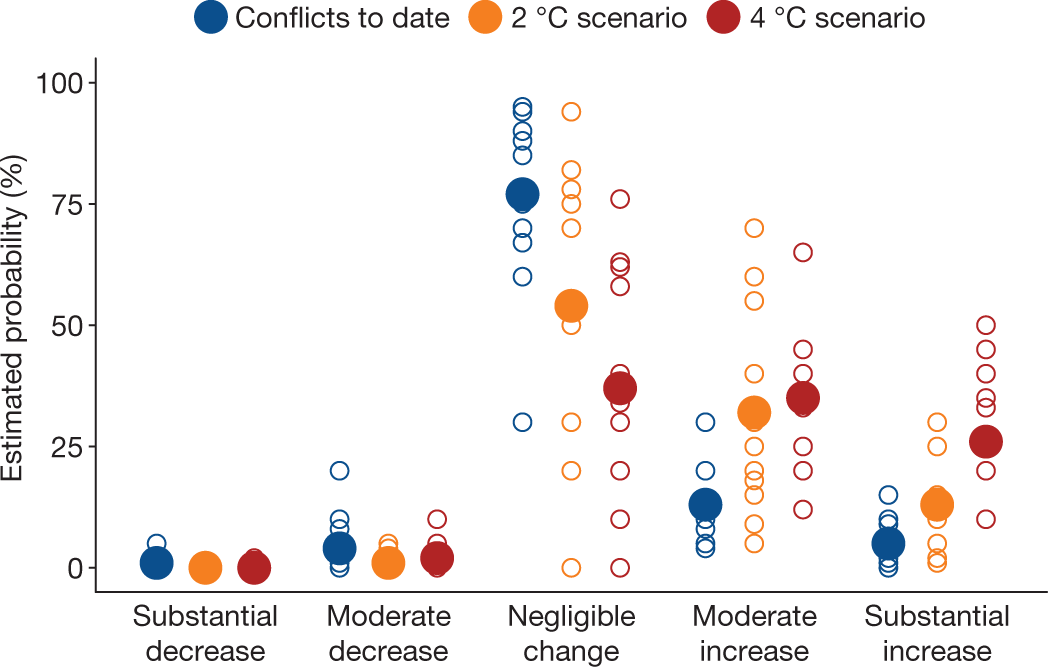
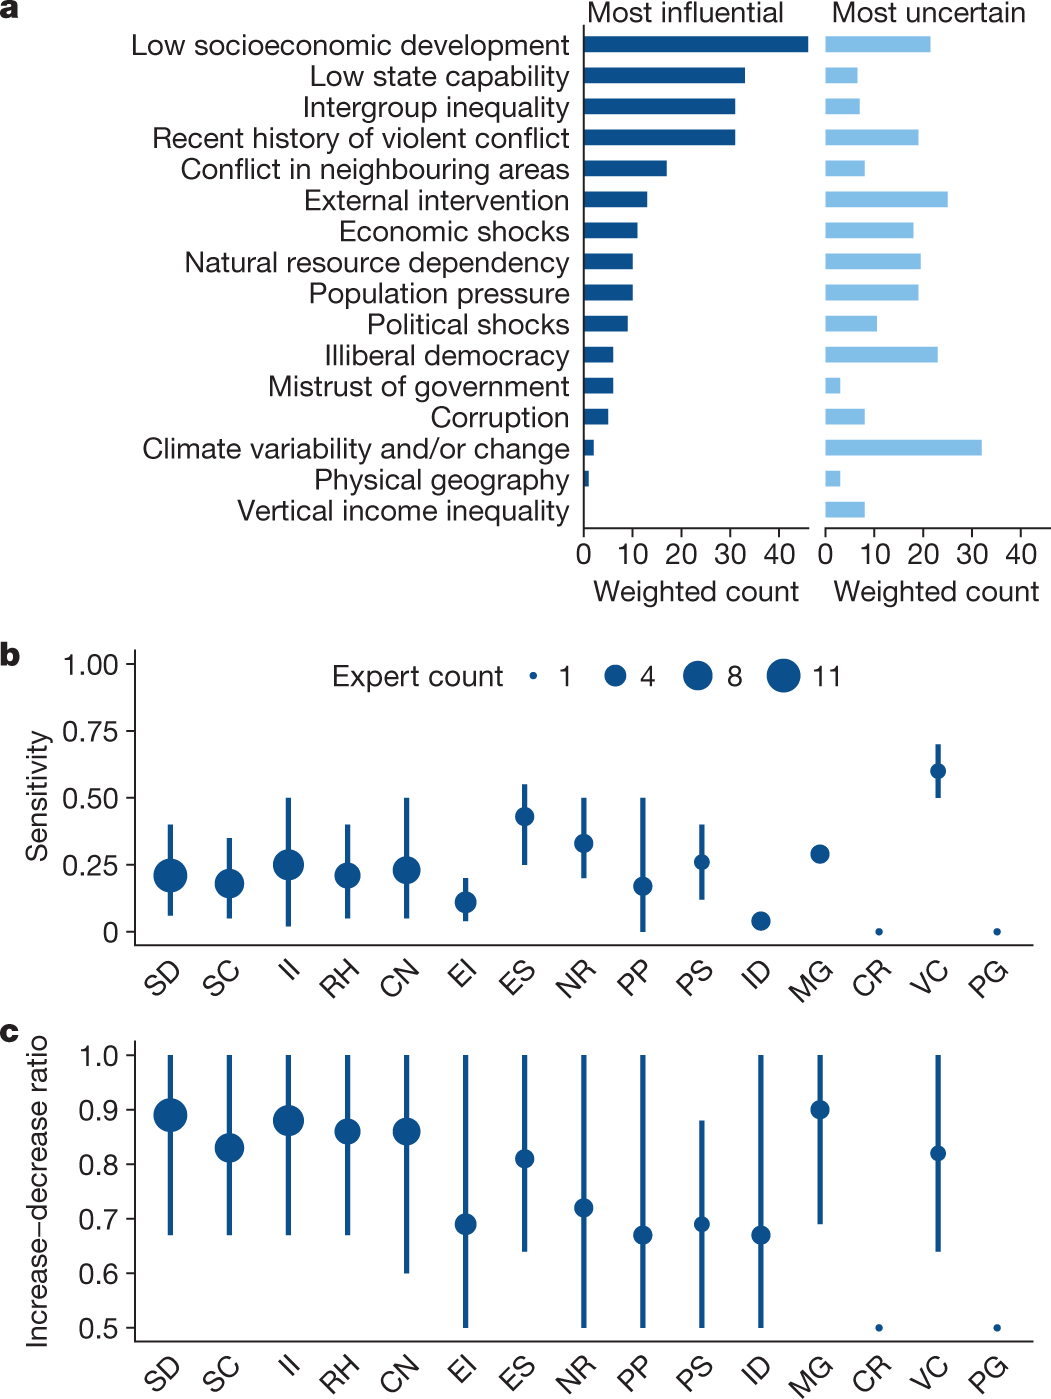
The paper I'll discuss in this post is from the current issue of Nature: Climate as a risk factor for armed conflict (Katharine J.Mach et al, Nature (2019) Published: 12 June 2019.
I'm not much of a social science person, but I found this paper interesting. Since I have no real expertise in the subject, perhaps I'll just post some excerpts and pictures.
My only remark would be to say that while any debate about whether climate change is "real" is a manufactured debate, completely and totally equivalent to a far less (in terms of risk) exigent, although terrible, debate about whether cigarettes caused cancer: The science is clear, but marketing people for the vested economic interests are spectacularly successful at suppressing the science, utilizing public ignorance about science as a rapier.
From the paper:
...Expert elicitation is a well-vetted method for documenting the judgments of experts about available evidence29 (Methods). For societally relevant topics with divergent evidence, experimental comparisons of structured elicitation and group-panel assessment have suggested that individual elicitation paired with collective assessment can better reveal the state of knowledge than either approach in isolation30,31,32. Here, we develop a synoptic assessment of the relationship between climate and conflict...
...The authors of this manuscript consist of 3 assessment facilitators and a group of 11 climate and conflict experts. The group of 11 experts is a sample of the most experienced and highly cited scholars on the topic, spanning relevant social science disciplines (especially political science, economics, geography and environmental sciences), epistemological approaches and diverse previous conclusions about climate and conflict (Methods). The selection of the expert group was done based on expertise necessary to resolve scientific disagreement about the contribution of climate to conflict risks globally and in conflict-prone regions, which requires consideration of comparative and crosscutting analyses and replicable empirical research...
...The expert group participated in 6–8-h individual expert-elicitation interviews and a subsequent 2-day group deliberation (Methods). The interview and deliberation protocols were collectively developed by the authors and then administered by the assessment facilitators. In total, 950 transcript pages from the interviews and deliberation were iteratively analysed and distilled. The results presented here include subjective probabilistic judgments...
Graphics from the paper:
 ?as=webp
 ?as=webp
 ?as=webp
From the conclusion to the paper:
My opinion is that the risks are going to grow very, very, very, very, very fast, since the degradation of the climate is proceeding at the fastest rate ever observed. Moreover the rate of the rate, the second derivative, is also increasing.
The means of addressing climate change on either end of the political spectrum, the power inherent in which end is in control defining the response at a particular moment, are absurd: On the right, denial, and on the left, endless affection for so called "renewable energy," which is not, in fact, renewable, being resource intensive, and which has not worked, is not working and will not work.
History will not forgive us, nor should it.
I hope you're having a pleasant weekend. The weather here in New Jersey is beautiful today.
Elucidation of the Molecular Signatures of 2 Gulf of Mexico Oil Disasters by 2D GC/MS (GCXGC/MS)
The paper I'll discuss in this post is this one: Exploring the Complexity of Two Iconic Crude Oil Spills in the Gulf of Mexico (Ixtoc I and Deepwater Horizon) Using Comprehensive Two-Dimensional Gas Chromatography (GC × GC)
The Gulf of Mexico is being destroyed by two closely related forms of energy, the dangerous fossil fuel petroleum, and the dangerous form of so called "renewable energy," ethanol.
Because so called "renewable energy" has been absolutely ineffective at addressing climate change, the climate catastrophe is accelerating at the fastest rate ever seen, and to be sure, one effect has been the flooding of the American Midwest that took place in early spring, on highly fertilized corn and wheat fields. These floods are draining into the Mississippi carrying the fertilizer, phosphorous and fixed nitrogen into the Gulf of Mexico, where it causes heavy toxic blooms of algae that choke off the oxygen, killing fish, shrimp, oysters, crabs and the economic life of fishermen and fisherwomen. Because of this year's flooding, NOAA is predicting the largest ever Gulf of Mexico dead zone, close to 8,000 square miles of a completely dead region of the Gulf at the Mouth of the Mississippi.
Thank you Iowa caucuses.
Don't worry, be happy.
"Bioenergy," which is responsible for slightly less than half of the 7 million air pollution deaths that take place each year grew by 15.16 exajoules to 57.99 exajoules.
IEA 2017 World Energy Outlook, Table 2.2 page 79 (I have converted MTOE in the original table to the SI unit exajoules in this text.)
In this century, world energy demand grew by 164.83 exajoules to 584.95 exajoules.
In this century, the solar, wind, geothermal, and tidal energy on which people so cheerfully have bet the entire planetary atmosphere, stealing the future from all future generations, grew by 8.12 exajoules to 10.63 exajoules.
Probably even worse than so called "renewable energy," for cars, corn ethanol, however, are the oil disasters in the Gulf. In the 21st century, oil has been the second fastest growing source of energy (an increase of 30.23 exajoules to 185.68 exajoules) second only to coal (an increase of 60.25 exajoules to 157.01 exajoules).
The two major oil disasters of the last 40 years in the Gulf of Mexico (outside of climate change itself) are the Deepwater Horizon disaster and the Ixtoc 1 disaster.
From the text of the paper:
Two examples of such oil releases are the Ixtoc I and the Deepwater Horizon (DWH) blowouts, both occurring in the Gulf of Mexico (GoM). The Ixtoc I spill lasted from June 3, 1979 to March 23, 1980, releasing an estimated 3 000 000 barrels of crude into the southern GoM (lat: 19° 24? 30.00? N, lon: ?92° 19? 30.00? W). The spilled product traveled along the Mexican coastline and also impacted the Texas coastline.1 Thirty years later on April 20, 2010 and lasting for 87 days, an estimated 5 000 000 barrels flowed from the damaged Macondo well, following the explosion of the DWH drilling rig (lat: 28° 44? 11.86? N, 88° 21? 57.59? W).2 Contrary to the DWH accident, the impacts of the Ixtoc I spill are far less understood due to limited post-spill research and monitoring efforts. In order to close this research gap, recent studies have identified areas in the southern GoM, where residues from the Ixtoc I spill continue to persist.3,4
Forty years after Ixtoc "residues...continue to persist."
(If you want to have some fun, you can try reading some "by 2020" predictions made in 1980 about how great so called "renewable energy" would be doing by now. Apparently the people of that time thought we'd be just all tooling around in our solar powered hydrogen HYPErcars by now.)
In terms of analytical chemistry science, the technique here is one that's been exploding quite a bit in recent years, 2D chromatography. A problem in chromatographic separations can be (and is) that closely related compounds can co-elute, that is obscure the presence of one another. Years ago, when I was a kid, 2D thin layer chromatography was a neat tool that was simple and easy to use. One would place a spot on a square TLC plate, elute with one solvent system, then flip the plate 90 degrees and elute with a second solvent system to separate any spots that actually contained more than one compound. In modern times, these same techniques have been applied to instrumental systems, 2D HPLC, and in this case, 2D gas chromatography.
The detectors here were high resolution time-of-flight mass spectrometers, with the mass spectrometer creating another degree of orthogonality to the analysis. The authors refer to this technique as GCXGC-HRT, rather than the more traditional GCXGC TOF terminology.
The authors are able to separate some very closely related compounds from the two oil spills, benzothiophenes, and using the differences in distribution, delineate which oil disaster is responsible for the destruction in particular areas of the Gulf.
Some pictures from the text:


Pretty, isn't it?
The beauty of the science here, the wonderful advanced analytical techniques is somewhat marred by the results it shows. Is this not true?
From the conclusion:
There are some questionable locutions here: The word "iconic" usually connotes a positive connection with an event; its etymology derives from "icon," a representation of something godly. While petroleum is regarded by some as god-like, it, um, really isn't, particularly when leaking into ecosystems. The other poor choice of words is the use of the word "biomarker" which usually refers to metabolic compounds in living systems, not in areas rendered dead by oil spills.
Anyway...
If unlike me, you're happy and not worried that all the "by 2050" blabber we're hearing in 2019 will pan out rather like all the "by 2020" blather in 1980, well, I really have nothing to say, since I feel I've already said everything I can say and am now reduced to repeating myself like a victim of auto-echolalia.
And so I repeat and repeat and repeat:
We clearly hate our children and our grandchildren and their grandchildren, because if we didn't, we wouldn't be blithely dumping responsibility on them to do precisely what we have been unable to do ourselves.
We're not doing anything to address our dependence on dangerous fossil fuels and in fact, couple them with the only real alternative to them, nuclear energy, in our emotional, if absurdly toxic, imaginations. We are so mindless that we think that the damage related to Fukushima is somehow worse than the annual destruction of the entire ecosystem of the Mississippi Delta region, and we allow events like Ixtoc and Deepwater to vanish down the the memory hole while continuing to worship our cars.
Nothing will happen "by 2050" because we are doing nothing now.
I trust you'll have a pleasant weekend.
Record High Magnetic Field (45.5 Tesla) Achieved Using High Temperature Superconducting Ceramic.
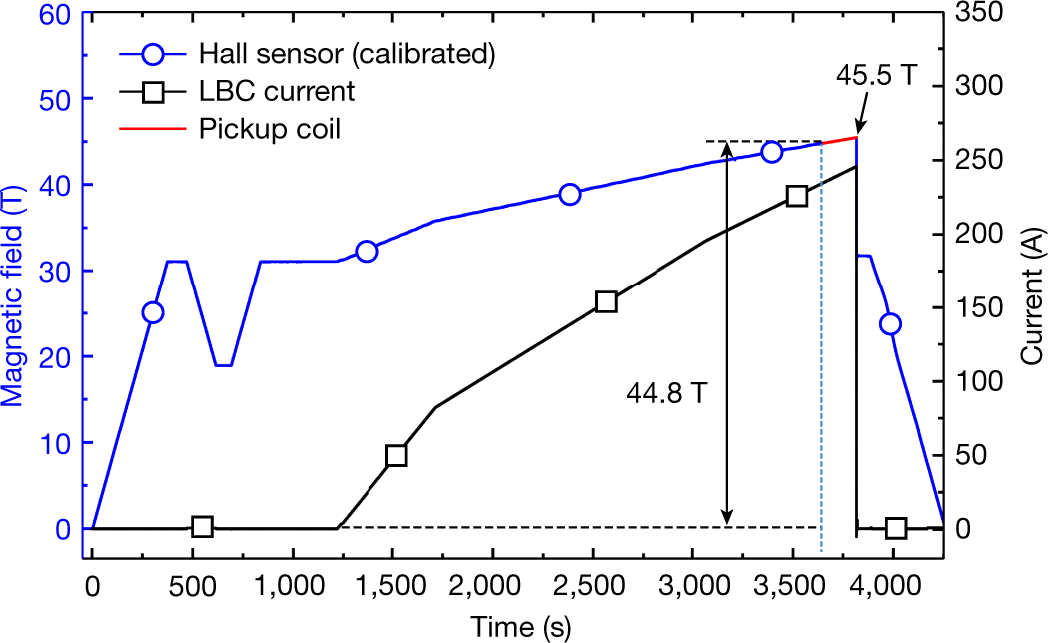
The paper I'll discuss in this post is this: 45.5-tesla direct-current magnetic field generated with a high-temperature superconducting magnet (David C. Larbalestier et al Nature, Published On Line 6/12/2019).
Recently I met with an old friend and his wife for dinner, who I hadn't seen for a long time, and we got around, of course, as old friends do when they get old, to talking about our kids, and when I discussed what my kid is doing over the summer we got on the subject of neutrons. I think about all the time about neutrons, albeit in a very different way than my son thinks about them, since my son is concerned with their De Broglie wavelengths and I personally am not at that level of detail with neutrons and couldn't care less (effectively) about neutron wavelengths (although probably I should). Anyway, I told my friend that my kid would be working with neutron beams, which generated the question from my friend, chemist to chemist (since we think about mass spec), "How can you focus neutrons? They have no charge."
I answered, "You can't."
A short time afterwards my kid and I were chatting on the phone and he told me all about the "big" magnet they have in the lab where he's working, which is a 14 Tesla magnet and we got to talking and he reminded me that neutrons have a magnetic moment (thus proving that they cannot truly be elementary particles).
So there's that.
Anyway, in my lazy head, I kind of thought that the upper limit for magnets was in the neighborhood of nine or ten Tesla, and I was impressed to hear that I was wrong, but I had no idea of how wrong I was.
I recall the first time I saw a "high temperature" super-conducting material; it was at an ACS local section meeting in San Diego where the speaker, whose name I've forgotten, brought a Dewar of liquid nitrogen (the "high temperature" as compared to liquid helium in most superconducting magnet systems) and some tiny little disks. He soaked the disks in liquid nitrogen, applied a current to them and did some levitation experiments using a strong conventional magnet.
At that time in my life, I was inclined to have unrealistic fantasies of the type where wind turbines in North Dakota powered Southern California using superconducting power lines.
The rap on this lanthanide/copper oxide "high temperature" superconductors was #1 that they could only carry a low density current before breaking down and #2, that they were ceramics and could not be drawn into wire.
Scratch that, well, maybe not a wire, but a tape...
From the (open sourced) abstract:
...and some more from the text of the paper...
The coil was the third in a series of LBCs, with LBC1 reaching 40 T, LBC2 attaining 42.5 T and LBC3 achieving 45.5 T, all in the same 31.1-T background field and all with nominally the same design. We found that tests in liquid nitrogen were valuable for checking joint resistances and establishing key operation parameters, including the coil constant, the characteristic coil resistance, Rc, and the charging time constant12,13,14,15. Occasionally some joints were remade to reduce resistive losses and minimize coil warming during test. For the high-field test, LBC3 was placed in a 37-mm-diameter liquid helium cryostat inside the resistive background magnet (50-mm warm bore, 18 MW, 31.1 T) at the National High Magnetic Field Laboratory (MagLab). To mitigate trapped helium bubbles, which allow heating of the magnet above 4.2 K during charging16, a small-diameter tube above the magnet periodically pumped away helium vapour during the test so as to limit the temperature of the top surface of LBC3, which reached 7 K at the moment of the 45.5-T quench. A Hall sensor calibrated up to 44.8 T in the 45-T hybrid magnet was used to measure the centre field, together with a pickup coil (the linearity of which was confirmed in multiple charging tests before the main 45.5-T test).
Some pictures from the paper:
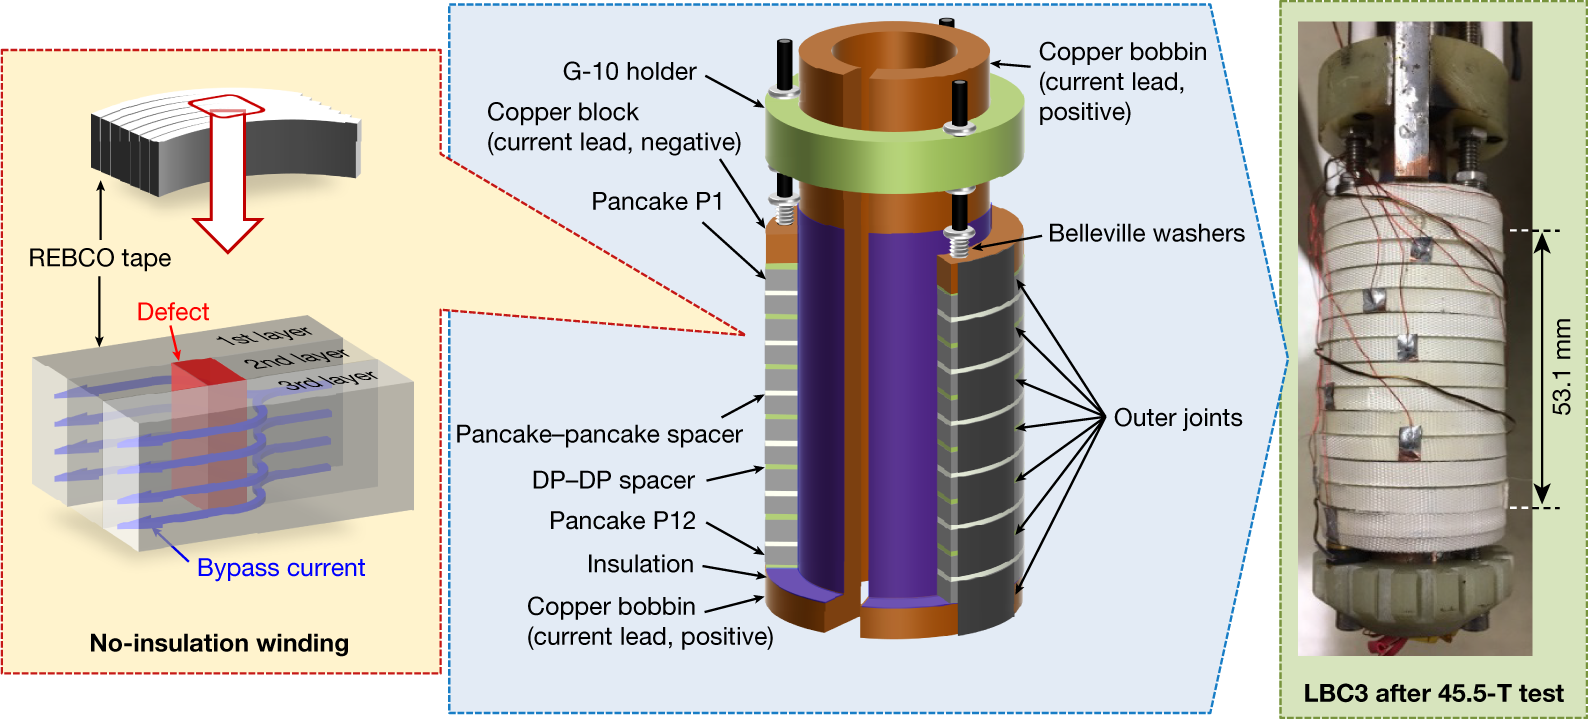
The caption:
The caption:
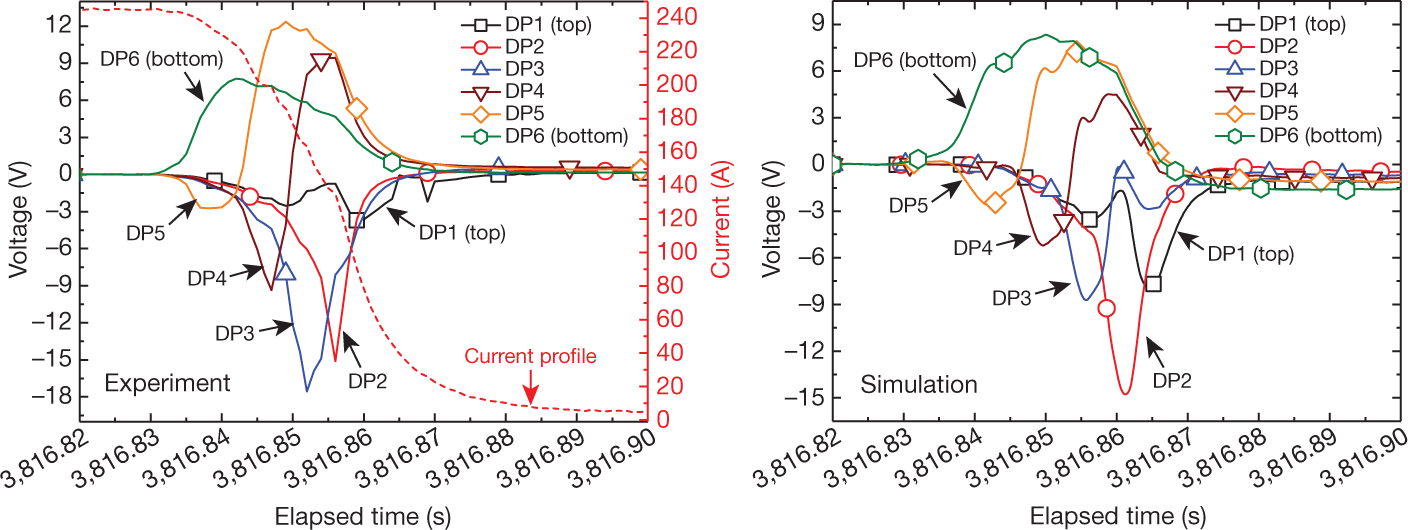
The caption:
Quenching the current however led to some degradation of the tapes.
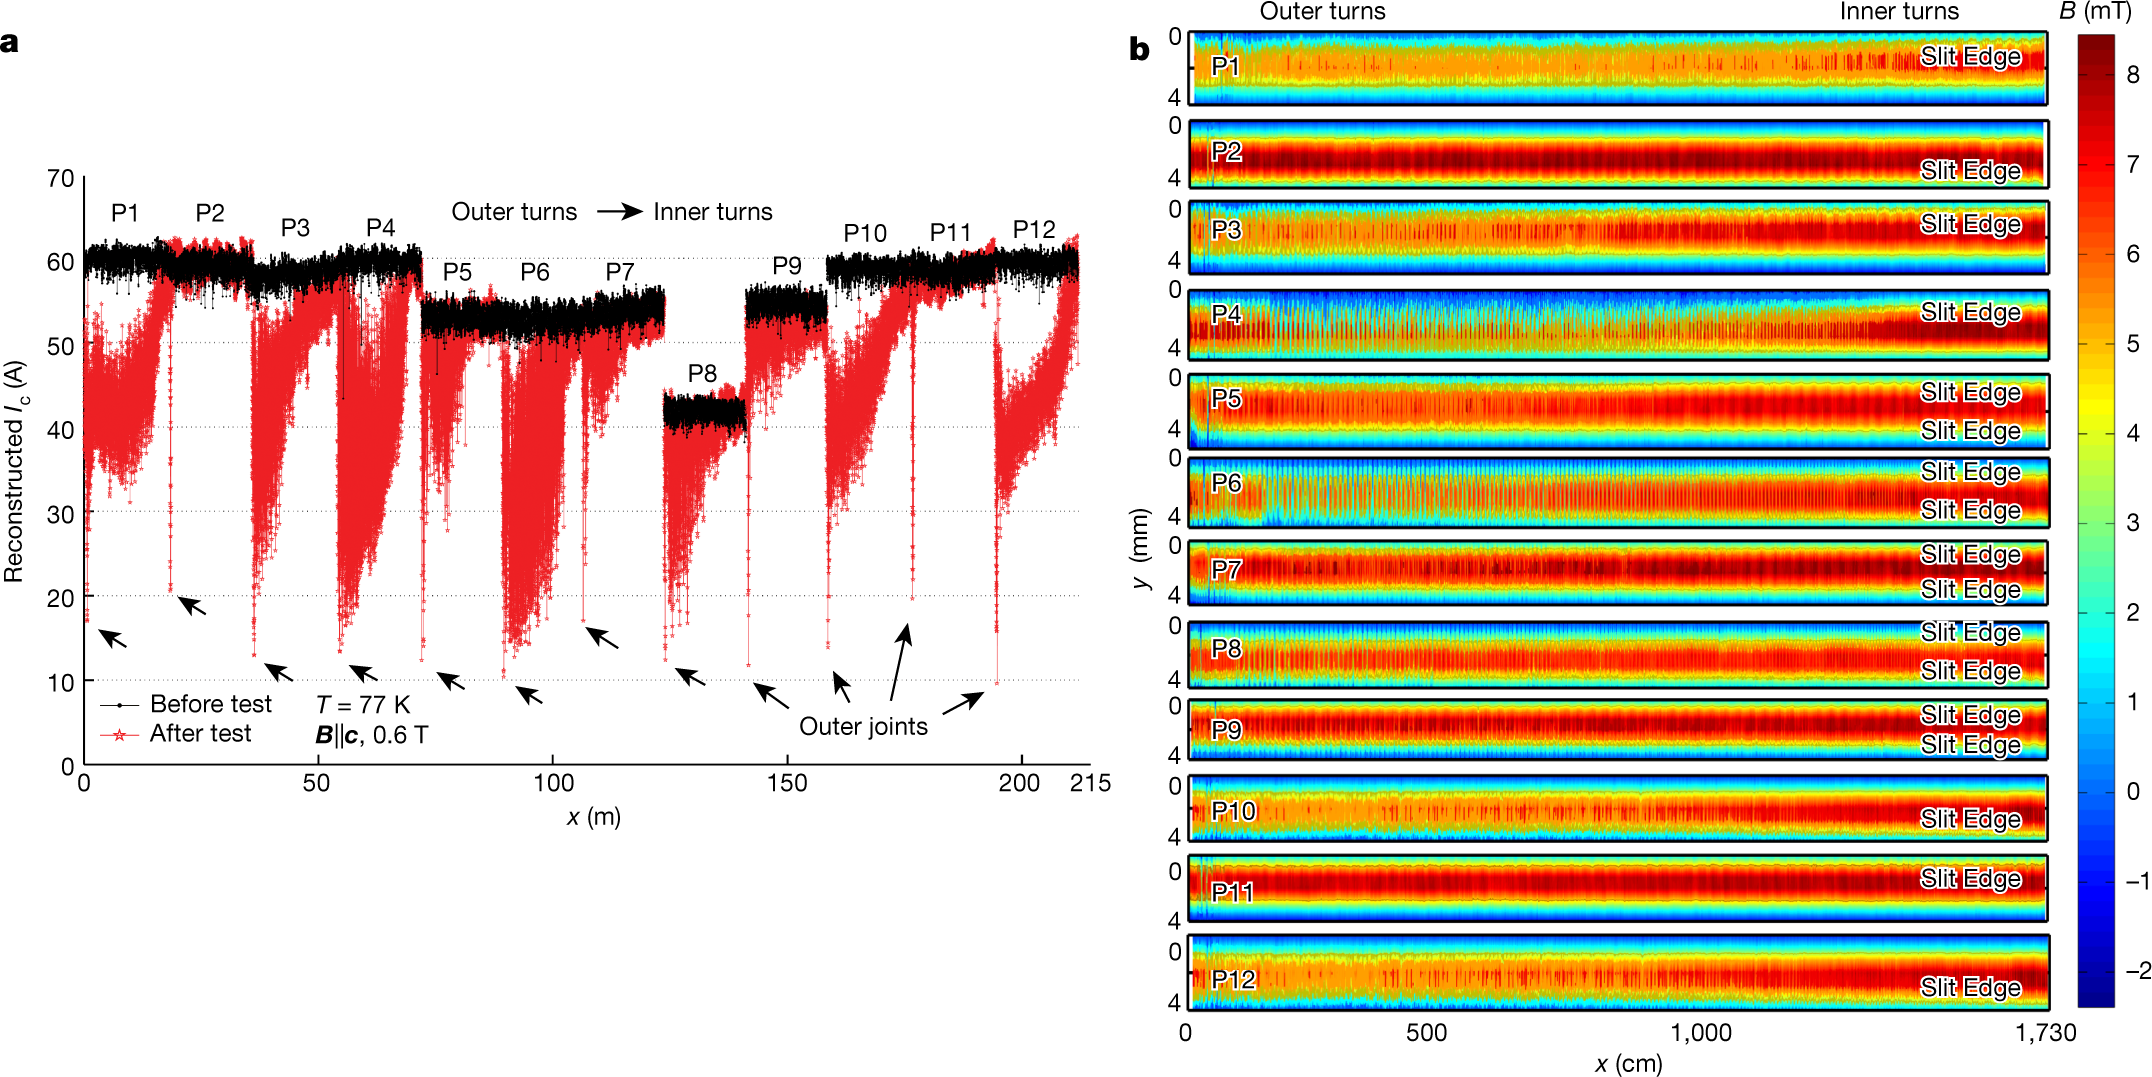
The caption:
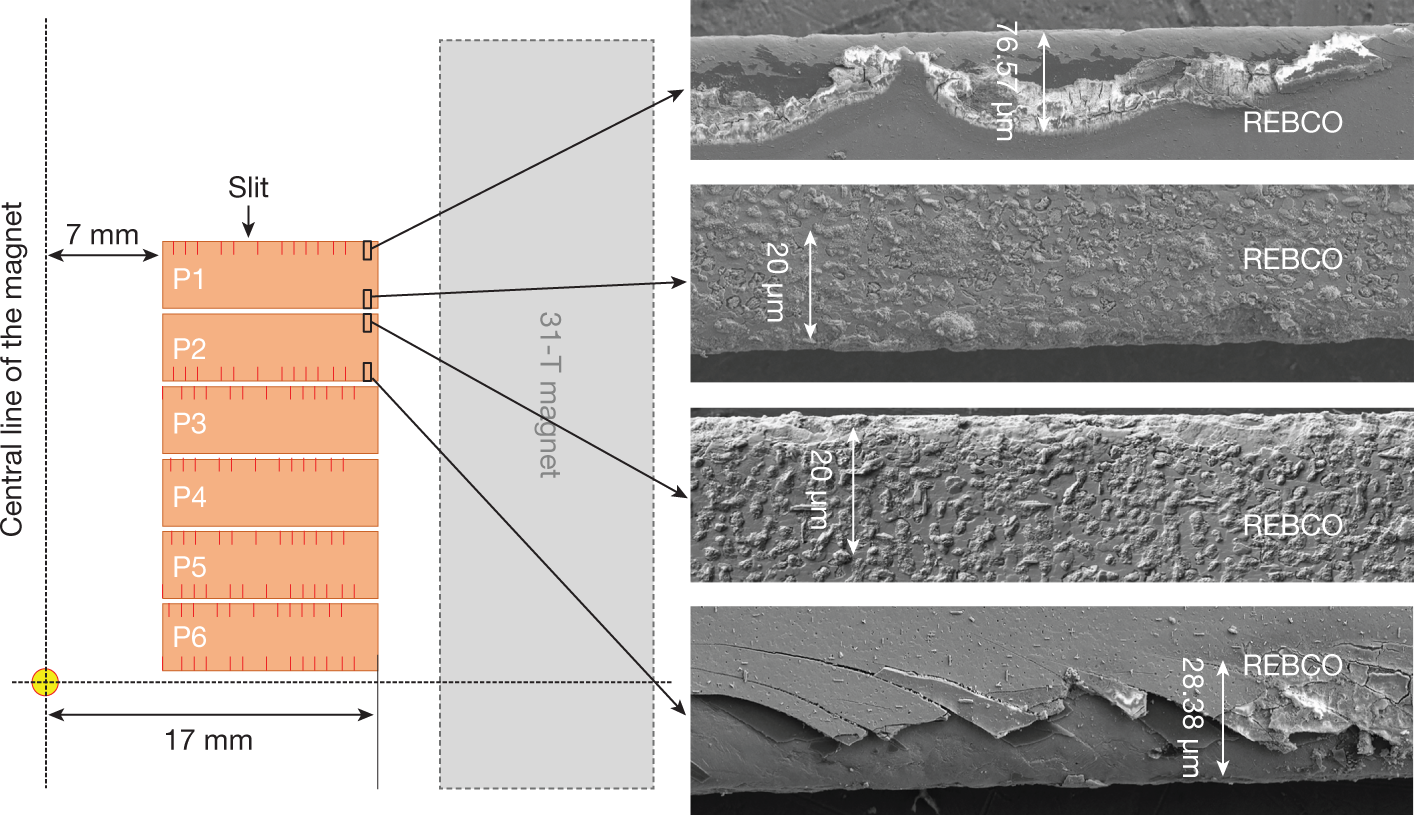
The caption:
Some concluding commentary:
Cool...or hot...
Well, you get the idea.
I trust you had a very pleasant Wednesday.
Venus, Earth's Evil Twin: Once a water-rich Eden, the hellish planet could reveal...
...how to find habitable worlds.
The news item I'll briefly discuss (I believe it's open sourced, so I'll just put some teasers in for anyone who is interested) is this one: Venus is Earth’s evil twin — and space agencies can no longer resist its pull (Shannon Hall, Nature 570, 20-25 (2019))
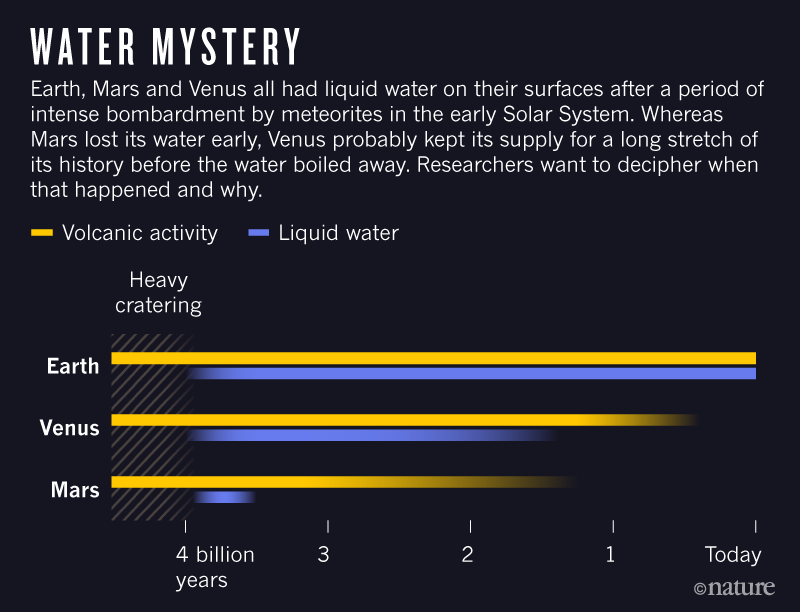
That could mean that Venus was (somewhat surprisingly) the first habitable planet in the Solar System — a place where life was just as likely to arise as it was on Earth. That alone is a reason to return to the former ocean world. “Why are we investing so much time looking for life on Mars when it only had liquid water for 400 million years?” Dyar asks. “And then there’s Venus with three billion years of water and no one loves her.”
Yet there’s no question that something went terribly wrong. Although Earth and Venus began in a similar fashion, the two have wandered down drastically different evolutionary paths — diverging perhaps as recently as 715 million years ago. That might seem like a reason not to visit, but scientists now argue that it makes the planet even more intriguing...
I have a guess about what went wrong. The Venusians discovered oil on their planet and started using it until along came the Venusian Elon Musk who said he would save the planet with wind turbines, solar cells and, um, electric cars, because everyone on Venus needed a car.
Profile Information
Gender: MaleCurrent location: New Jersey
Member since: 2002
Number of posts: 33,512