A Predictive Biomarker Is Found to Measure the Effectiveness of SARS-Cov-2 Vaccines. [View all]
In this post I will briefly discuss a news item in Nature, this one: Scientists zero in on long-sought marker of COVID-vaccine efficacy
I will then point to the paper it references, which should be open sourced: Khoury, D.S., Cromer, D., Reynaldi, A. et al. Neutralizing antibody levels are highly predictive of immune protection from symptomatic SARS-CoV-2 infection. Nat Med (2021).
Subtitle: Data from seven vaccination trials help to identify a blood marker for protection against the disease.
A biomarker, (or blood marker) for those who do not know, is a chemical found in tissue - often but not always blood - that indicates the presence, absence, and in some cases, the probability of a disease state. Common examples of which most people are aware are glucose levels for diabetes, A1Ac for type 2 diabetes, cholesterol, for heart disease, troponin for heart attacks, so and so on...
The discovery of biomarkers is sometimes non-trivial, and often they depend of measuring patient outcomes in clinical trials (or in epidemiological studies) along with a "shotgun" series of measurements of multiple species in a data independent setting, in the mass spec case, or, infectious diseases ligand binding "sandwich" assays which utilize receptors displayed on the surface by the offending organism or viral particle, or degradants of the particle or organism (for example qPCR type RNA tests to detect Covid.)
There are many complications in measuring antibodies, since they are protein molecules with a large nearly invariant structure, having a Y shape, with the stem of the "Y," called the Fc region, being generally completely the same for differing antibodies with different functions. Their activity is determined by a small sequence of amino acids, called the "CDR" - the complementarity determining region - found at the tips of the arms; the arms are called the Fab region. If one relies entirely on binding, one can have problems with cross reactivity, the precise nature of a CDR can be determined by a hybrid "immune capture"/digestion/mass spec approach.
Antibodies come in two flavors, neutralizing and binding - binding can represent a signaling tool - and there is considerable evidence that other factors are involved in protection or recovery from Covid, notably T-Cells. As it sounds, "neutralizing antibodies" prevent viral infection, preventing the viral particle from entering a cell; T-cells destroy the viral particles completely.
Nevertheless, the biomarker discussed in the news item focuses on neutralizing antibodies.
The news item and the motivating paper are probably open sourced, but a few excerpts first from the news item:
After people have been vaccinated against COVID-19, the levels of infection-blocking antibodies in their blood are a strong indicator of how much protection they’ve gained against the disease, according to a modelling study1. The research showed that the presence of even small quantities of these potent ‘neutralizing antibodies’ indicates that a vaccine is effective at protecting against COVID-19.
The study is the best attempt yet to define features of the immune response that can act as a proxy for protection against COVID-19, known as a ‘correlate of protection’, says Daniel Altmann, an immunologist at Imperial College London. “Finding the correlate of protection has really been a holy grail for this disease, as for others. It’s surprisingly hard to do.”
If researchers have a well-defined correlate of protection, they can predict from early trial data how effective a vaccine will be, says James Triccas, a medical microbiologist at the University of Sydney in Australia and a co-author of the study. This “alleviates the need to do larger, more expensive and time-consuming phase III trials”.
Triccas and his colleagues examined neutralizing-antibody data from trials of seven widely used vaccines. The team found a strong link between participants’ antibody levels recorded in early-stage trials and vaccine-efficacy results from late-stage trials. The researchers estimate that a vaccine has an efficacy of 50% even if it induces antibody levels 80% lower than those found, on average, in a person who has recovered from COVID-19.
Vaccines that generated the strongest neutralizing-antibody responses, such as the mRNA-based vaccines made by Moderna and Pfizer–BioNTech, were the most protective. Vaccines that induced a weaker response, which included the Oxford–AstraZeneca jab, provided lower levels of protection.
The researchers predict that because antibody levels wane over time, booster shots might be needed in about a year, but protection against severe disease could last many years even without them.
The findings help to explain why, despite studies showing that some variants of the SARS-CoV-2 coronavirus reduce the ability of neutralizing antibodies to block infection, most people who have been vaccinated, even with just one dose, don’t fare too badly if infected with those variants, says Altmann...
Excerpts and a few graphics suggesting when the need for booster shots will be required, from the referenced paper:
Severe acute respiratory syndrome coronavirus 2 (SARS-CoV-2) has spread globally over the past year, infecting an immunologically naive population and causing significant morbidity and mortality. Immunity to SARS-CoV-2 induced either through natural infection or vaccination has been shown to afford a degree of protection against reinfection and/or reduce the risk of clinically significant outcomes. Seropositive recovered subjects have been estimated to have 89% protection from reinfection1, and vaccine efficacies from 50 to 95% have been reported2. However, the duration of protective immunity is presently unclear, primary immune responses are inevitably waning3,4,5, and there is ongoing transmission of increasingly concerning viral variants that may escape control by both vaccine-induced and convalescent immune responses6.
A critical challenge at present is to identify the immune correlate(s) of protection from SARS-CoV-2 infection and thereby predict how changes in immunity will be reflected in clinical outcomes. A defined correlate of protection will permit both confidence in opening up economies and facilitate rapid improvements in vaccines and immunotherapies. In influenza infection, for example, a hemagglutination inhibition (HAI) titer of 1:40 is thought to provide 50% protection from influenza infection7 (although estimates range from 1:17 to 1:110, refs. 8,9). This level was established over many years using data from a standardized HAI assay10 applied to serological samples from human challenge and cohort studies. This assay is used to predict vaccine efficacy and to assist in the annual reformulation of seasonal influenza vaccines. At present, however, there are few standardized assays for assessing SARS-CoV-2 immunity, little data comparing immune levels in susceptible versus resistant individuals, and no human challenge model11.
The data currently available for SARS-CoV-2 infection include immunogenicity data from phase 1 and 2 studies of vaccines, and data on protection from preliminary reports from phase 3 studies and from seropositive convalescent individuals (Supplementary Tables 1 and 2). Although antiviral T and B cell memory certainly contribute some degree of protection, strong evidence of a protective role for neutralizing serum antibodies exists. For example, passive transfer of neutralizing antibodies can prevent severe SARS-CoV-2 infection in multiple animal models,12,13 and Regeneron has recently reported similar data in humans14...
Since different antibody assays were utilized in different clinical trials for different vaccines, the authors developed a method of normalizing them.
They found that neutralizing antibody levels correlated well with protection from active
symptomatic infection or reinfection.
Some figures from the text:
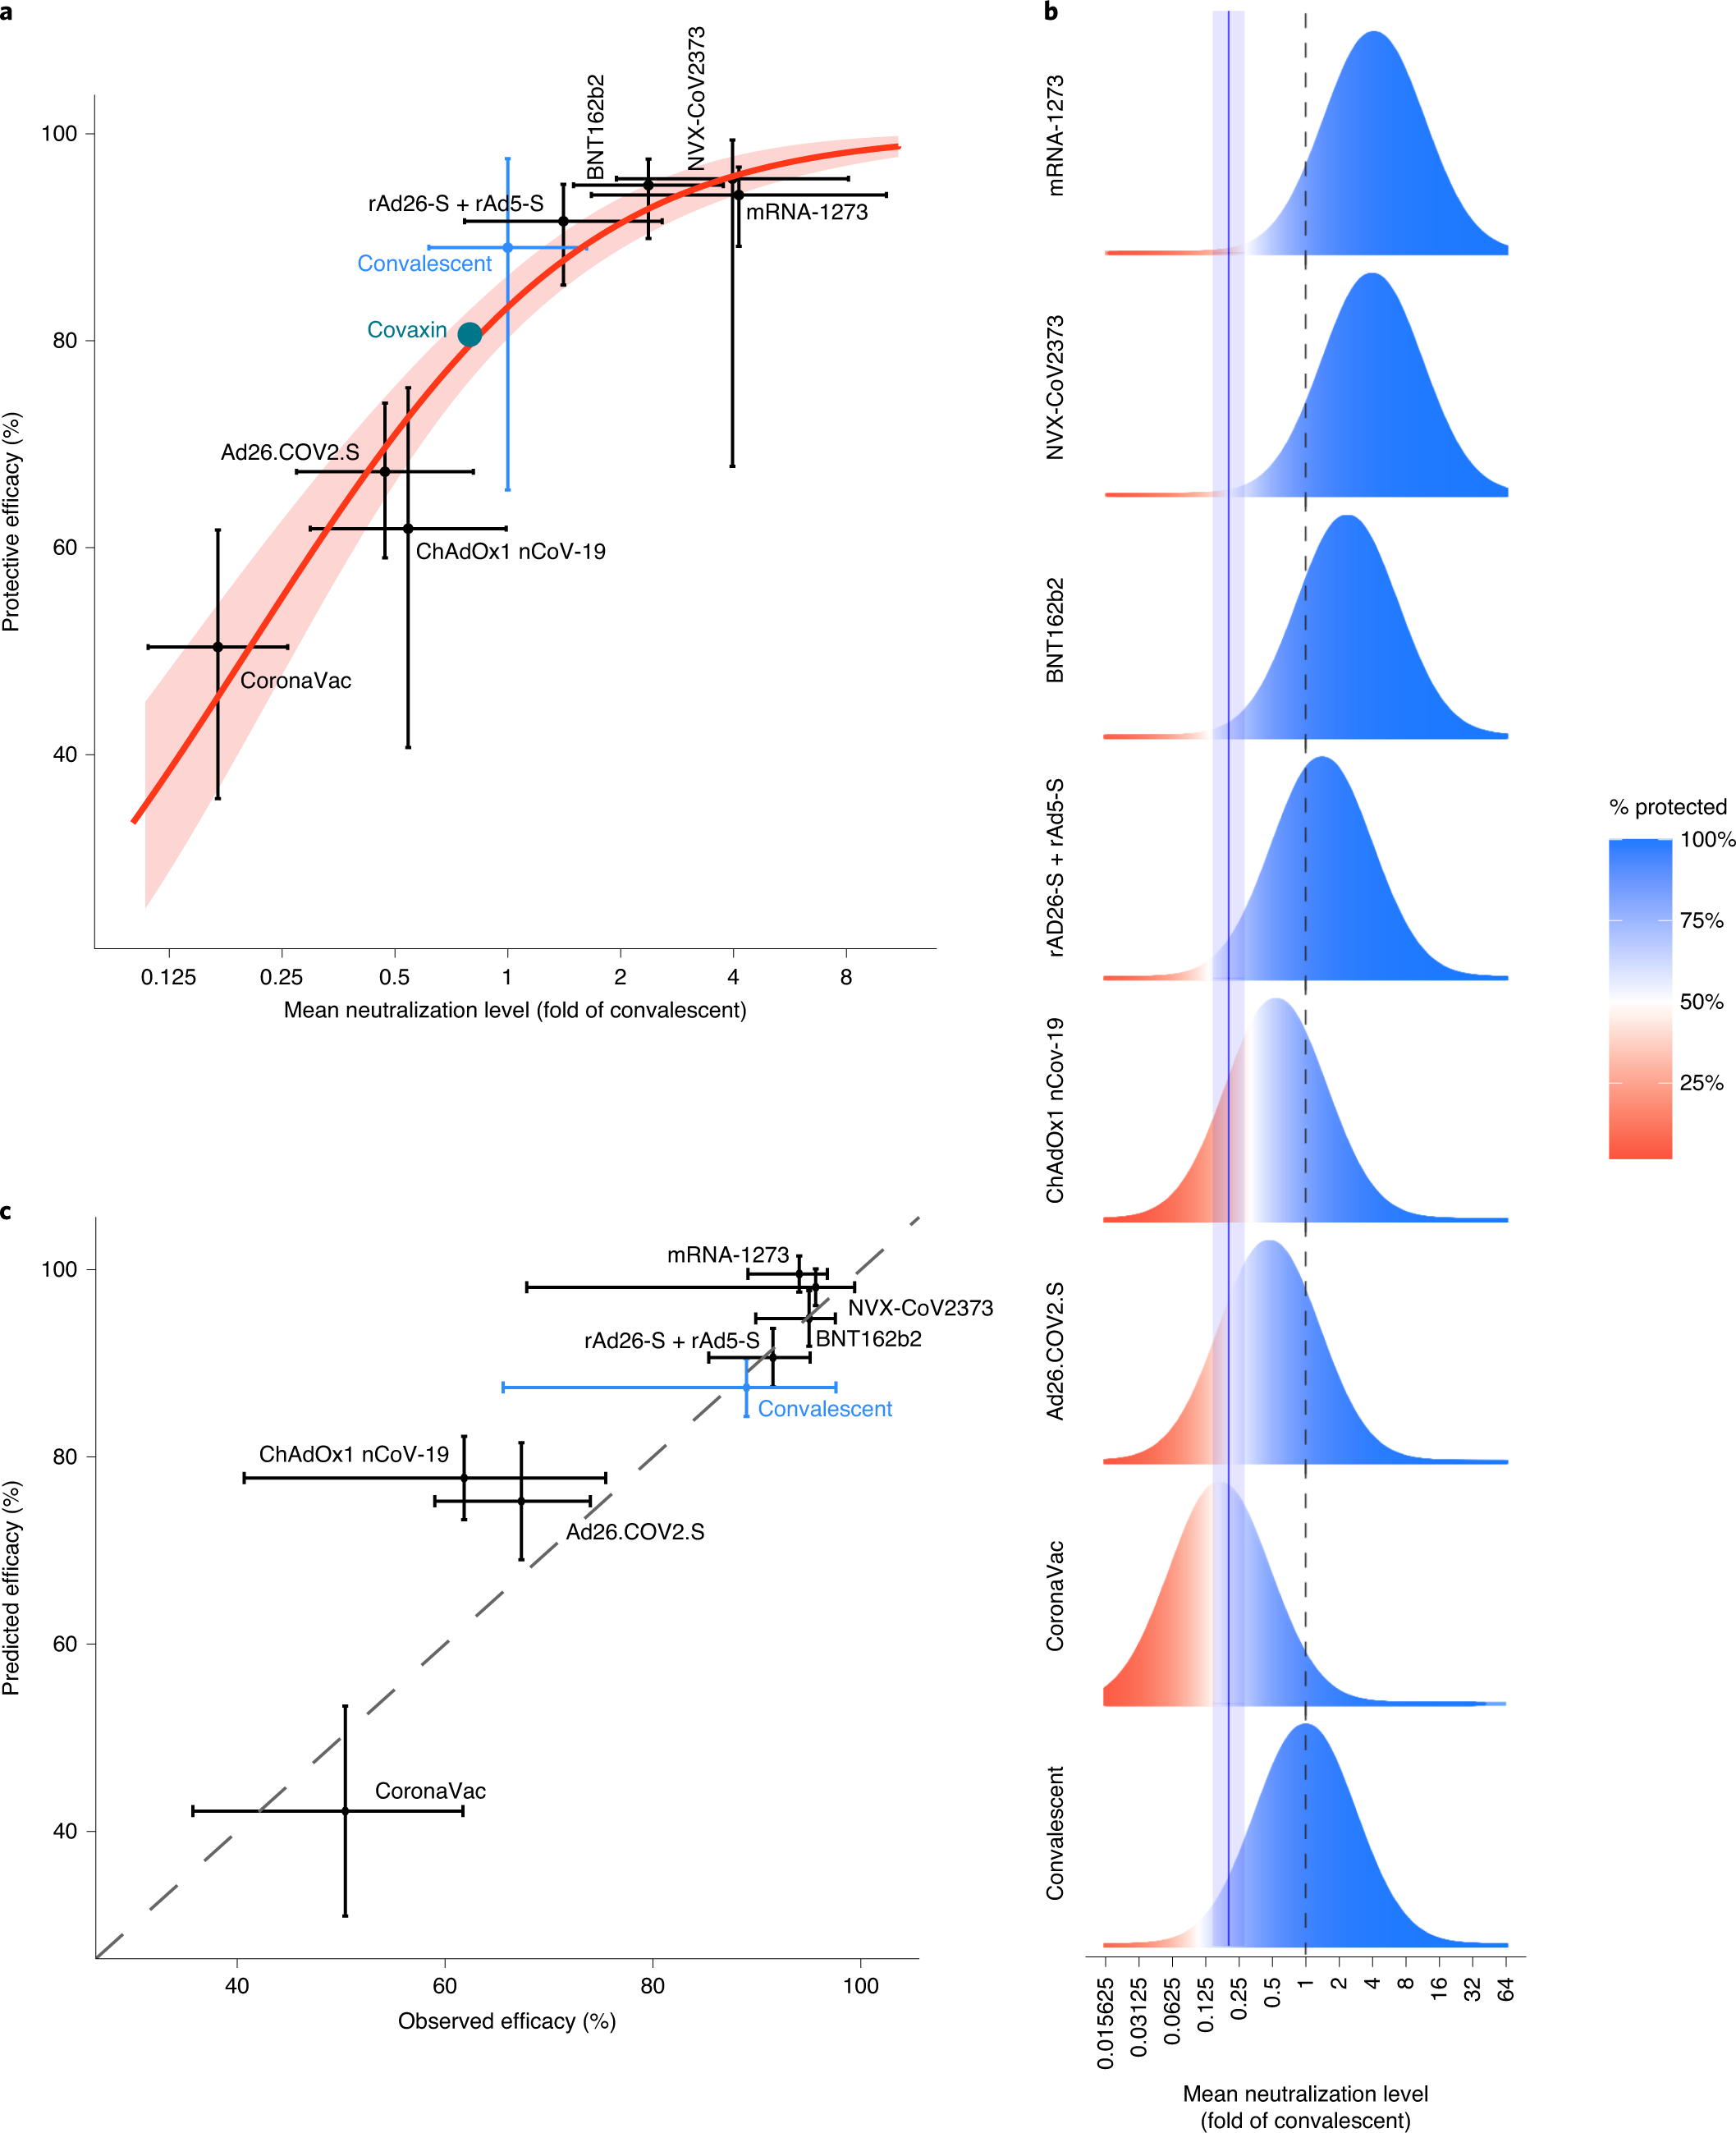
Fig. 1: Understanding the relationship between neutralization and protection.
The caption:
a, Relationship between neutralization level and protection from SARS-CoV-2 infection. The reported mean neutralization level from phase 1 and 2 trials and the protective efficacy from phase 3 trials for seven vaccines, as well as the protection observed in a seropositive convalescent cohort, are shown (details of data sources are given in Supplementary Tables 1 and 2). The 95% CIs are indicated as vertical and as horizontal whiskers. The red solid line indicates the best fit of the logistic model and the red shading indicates the 95% predictive interval of the model. The mean neutralization level and protective efficacy of the Covaxin vaccine are indicated as a green circle (data from this study were available only after modeling was complete and did not contribute to fitting). b, Schematic illustration of the logistic approach to identifying the protective neutralization level. The data for each study include the distribution of the measured in vitro neutralization titer against SARS-CoV-2 in vaccinated or convalescent subjects (as a proportion of the mean titer in convalescent subjects (dashed line)) (blue/red bell curve), accompanied by a level of protective efficacy for the same regimen. The efficacy is illustrated by the proportions of the bell curve ‘protected’ (blue) and ‘susceptible’ (red) for individual studies. The modeling fits the optimal 50% protective neutralization level (blue solid line, the shaded area indicates the 95% CI) that best estimates the correct levels of protection observed across the different studies. c, Predictions of the leave-one-out analysis. Modeling was repeated multiple times using all potential sets of the seven vaccination studies and the convalescent study to predict the efficacy of the eighth study. The diagonal dashed line indicates the position of a 1:1 correlation (i.e., the relationship if the model were completely accurate). The horizontal whiskers indicate 95% CIs and the vertical whiskers indicate 95% predictive intervals.
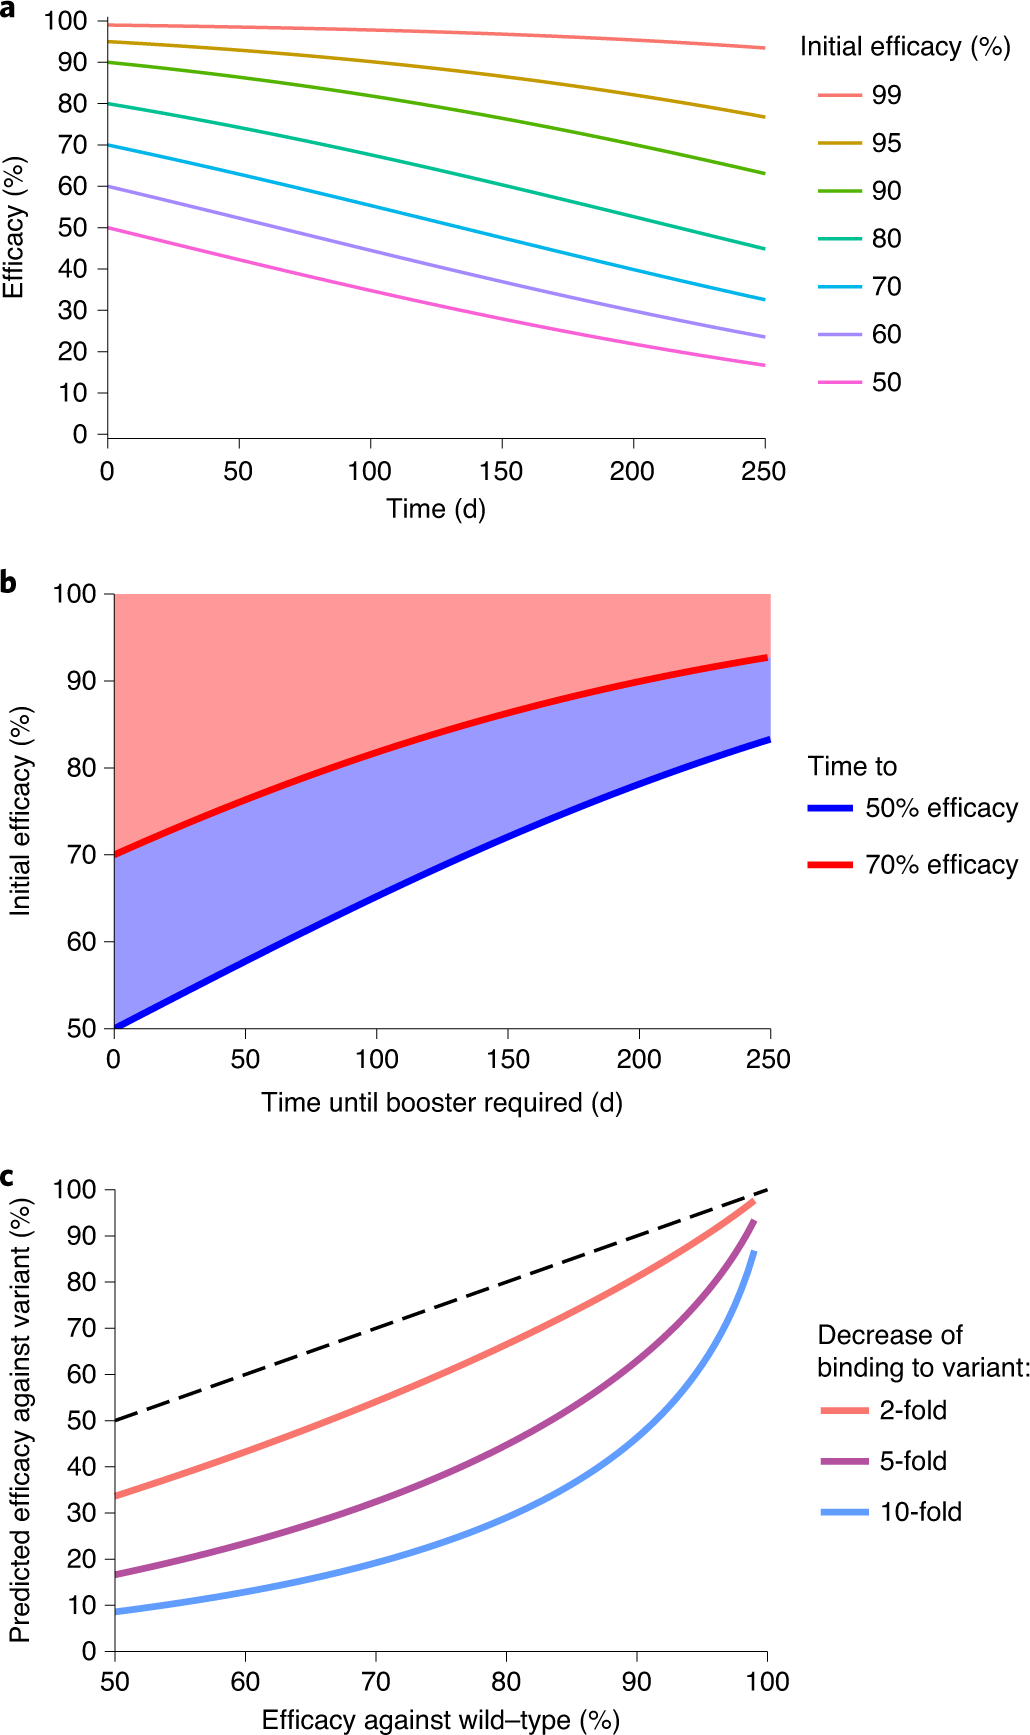
Fig. 2: The effects of waning neutralization titer on protection.
The caption:
a, Prediction of the effects of declining neutralization titer. Assuming that the observed relationship between neutralization level and protection is consistent over time, we estimate the decline in efficacy for vaccines with different levels of initial efficacy. The model assumes a half-life of the neutralization titer of 108?d over the first 250?d (as observed in a convalescent cohort5). b, Modeling of the time for efficacy to drop to 70% (red line) or 50% (blue line) for scenarios with different initial efficacy. For example, for a group starting with an initial protective efficacy of 90%, the model predicts that 70% efficacy will be reached after 201?d and 50% efficacy will not be reached before 250?d. c, Estimation of the impact of viral antigenic variation on vaccine efficacy. In vitro studies have shown that neutralization titers against some SARS-CoV-2 variants are reduced compared with titers against wild-type virus. If the relationship between neutralization and protection remains constant, we can predict the difference in protective efficacy against wild-type and variant viruses from the difference in neutralization level. The dashed line indicates equal protection against wild-type and variant strains. Details of the data and modeling are provided in the Methods.
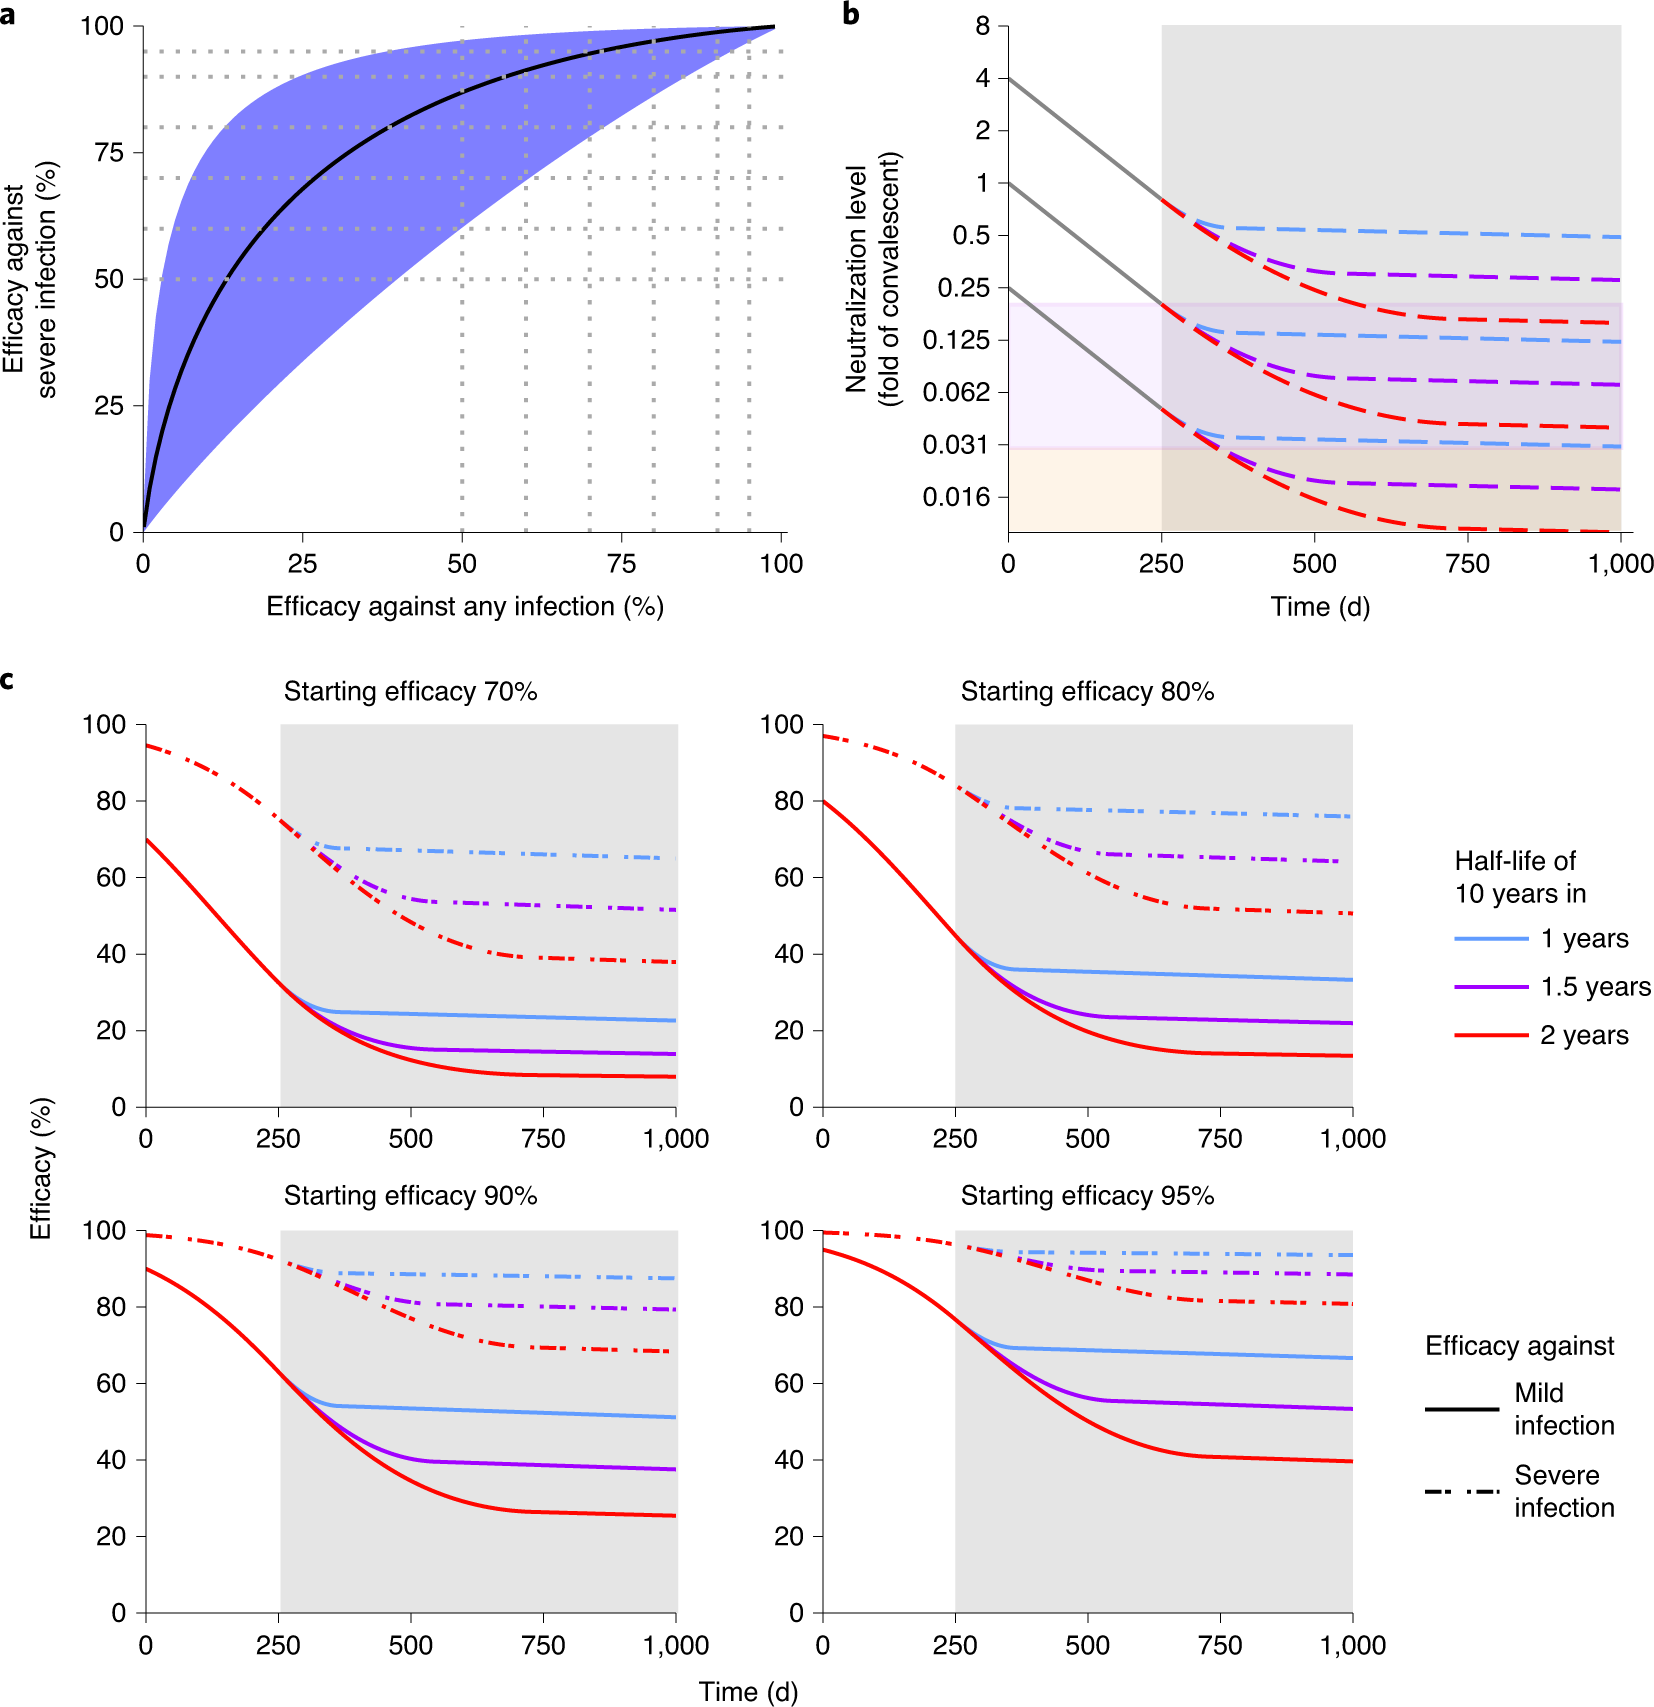
Fig. 3: Protection from severe infection.
The caption:
a, The predicted relationship between efficacy against any symptomatic SARS-CoV-2 infection and the efficacy against severe infection. The black line indicates the best fit model for the relationship between protection against any versus severe SARS-CoV-2 infection. The shaded areas indicate the 95% CIs. Efficacy against severe infection was calculated using a threshold that was 0.15 times lower than that for mild infection (95% CI?=?0.036–0.65) (see Methods and Supplementary Table 5). b, Extrapolation of the decay of neutralization titers over time. This model uses the estimated half-life of SARS-CoV-2 neutralization titer in convalescent subjects of 108?d over the first 250?d5, after which the decay decreases linearly until it achieves a 10-year half-life (consistent with the long-term stability of antibody responses seen after other vaccines47,48). We simulate three scenarios, with decay of neutralization taking 1?year (blue dashed line), 1.5?years (purple dashed line) or 2?years (red dashed line) to slow to a 10-year half-life. For different initial starting levels the model projects the decay in neutralization titer over the subsequent 1,000?d (the gray shaded area indicates projections beyond the currently available data). The purple shaded region indicates being below the 50% protective titer for any symptomatic SARS-CoV-2 infection, and the orange shaded region indicates being below the 50% protective titer for severe SARS-CoV-2 infection. The model illustrates that, depending on the initial neutralization level, individuals may maintain protection from severe infection while becoming susceptible to mild infection (that is, with neutralization levels remaining in the purple shaded region). c, Extrapolation of the trajectory of protection for groups with different starting levels of protection. The model uses the same assumptions for the rate of immune decay as discussed in b. The projections beyond 250?d (gray shaded region) rely on an assumption of how the decay in SARS-CoV-2 neutralization titer will slow over time. In addition, the modeling projects only how decay in neutralization is predicted to affect protection. Other mechanisms of immune protection may play important roles in providing long-term protection that are not captured in this simulation.
Some additional commentary by the authors:
As discussed above, a major caveat of our estimate of the relative protective level of antibodies in SARS-CoV-2 infection is that it includes aggregation of data collected from diverse neutralization assays and clinical trial designs (Supplementary Tables 1 and 2). It is hoped that in the future a standardized neutralization assay may be developed and utilized, which will allow direct comparison of neutralization titers and further refinement of these analyses11. In addition, the development of standardized trials and case definitions is necessary, given that differences in classification (particularly of severe disease) may prove to be important (Supplementary Table 3). The association of neutralization with protection across these studies does not prove that neutralizing antibodies are necessarily mechanistic in mediating protection. It is possible that neutralization is correlated with other immune responses, leading to an apparent association (as has been suggested for the use of HAI titer in influenza50,51,52). Thus, it will be important to study other responses such as T cell responses or B cell memory responses as additional potential correlates of protection. Another important refinement of this approach would be to have standardized measures of other serological and cellular responses to infection, to identify if any of these provide a better predictive value than neutralization. However, despite these limitations, our work identifies neutralizing antibodies as an immune correlate of protection and provides a quantitative prediction of the link between neutralizing antibody levels and clinical protection
The scientific community deserves a pat on the back for the speed and efficiency with which they have addressed this crisis in record time, despite the rising power of ignorance, indifference, mysticism, and the wide dissemination of outright lies.
Have a safe and happy weekend.
 = new reply since forum marked as read
Highlight:
NoneDon't highlight anything
5 newestHighlight 5 most recent replies
= new reply since forum marked as read
Highlight:
NoneDon't highlight anything
5 newestHighlight 5 most recent replies