General Discussion
Related: Editorials & Other Articles, Issue Forums, Alliance Forums, Region Forums [/IMG]
 = new reply since forum marked as read
Highlight:
NoneDon't highlight anything
5 newestHighlight 5 most recent replies
= new reply since forum marked as read
Highlight:
NoneDon't highlight anything
5 newestHighlight 5 most recent replies

world wide wally
(21,779 posts)yallerdawg
(16,104 posts)District 7 (Rep. Terri Sewell) is described as " the Black Belt" in Alabama. Those little fingers reaching out are more black voters. District 7 is Alabama's only Democratic representation in Washington, DC, and our only black representative.
1/3 of Alabama residents are non-white.


Dave Starsky
(5,914 posts)Hell, I work with statistics for a living, and even I have trouble explaining this to people.
This shows it very well, though.

Fred Sanders
(23,946 posts)
2naSalit
(90,504 posts)
Arkansas Granny
(31,695 posts)

DetlefK
(16,433 posts)It's in principle just a "roughness" of the outer boundary of the district. And there are multiple ways to define "roughness".
We define the perfect, most compact district as a filled circle. The center-of-mass (calculated from population-density) is defined as the center of the filled circle.
For example:
The roughness of the district-border can be defined via the fractal dimension.
At a perfect circle it's 2. The more pointy the district-border is, the closer it gets to 1.
For example:
The roughness of the district-border can be defined via the "peak-to-valley roughness".
You measure what is the shortest distance between the center of the district and the edge and what is the longest distance between the center and the edge. And then you calculate one minus the other. The more pointy the district-border, the farther this value will be away from 0. (You can normalize it to a percentage-scale to make it independent of the district-size.)
For example:
The roughness of the district-border can be defined via the "root-mean-square roughness".
It's mathematically slightly more complicated than the "ptv roughness", but it's preferred among scientists because it gives a more realistic view of what's going on. The more pointy the district-border, the farther this value will be away from 0. (This too can be normalized to a percentage-scale to make it independent of the district-size.)
Give a mathematician pencil, paper and 1 hour and he will design you a fair, non-partisan and near-perfect gerrymandering-system.
But who really wants that.
Instead of simply asking experts who do exactly this for a living, let judges and attorneys figure this out by arguing over whether one party lost more elections than it theoretically should have lost.
Jim Lane
(11,175 posts)For example, a mathematician given a blank map of South America would never draw the national borders the way they are. But Chile-Argentina isn't based on gerrymandering. It's just that drawing that boundary along the Andes Mountains made sense, especially in an age before air travel.
In the U.S., many nonpartisan districters give weight to pre-existing political lines as one factor to consider. It makes sense that everyone living in a particular city be in the same district. This tends to work against Democrats because of demographic patterns.
How would your mathematicians feel about the districts in the OP? I'll guess that Example 2 would be the best according to any of the algorithms you mention. That raises a non-mathematical question: Is it fair that a party with 40% of the population get 0% of the representatives? If we're talking about U.S. Senate seats, there's no practical way around that, but for the House or for state legislatures, there's a good argument that Example 1 in the OP is the fairest.
muriel_volestrangler
(102,047 posts)People may want a city to be in just one district, for instance, rather than being divided into 2 or more, each containing some suburbs and rural districts. Or they might consider the latter a more preferable solution, even when not taking partisan advantages into account. If you need to divide an area in two, there could be community reasons for a north-south dividing line, or an east-west one, that mathematics might not pick up.

KentuckyWoman
(6,837 posts)
calimary
(83,367 posts)
teamster633
(2,029 posts)
IronLionZion
(46,572 posts)which makes it easier for red to win if they have the state legislature and draw the lines to pack in as many Dems as possible into one district
NewJeffCT
(56,833 posts)but, the states that draw their district maps on a non-partisan basis are usually BLUE states. The most heavily gerrymandered states are often RED states.
I mean, California could turn around and engage in gerrymandering and instead of the 39-14 Democrats now, maybe they can take it to 46-7 with extreme gerrymandering? So, instead of 193 Democrats in Congress, you have 200 and only need 18 more to retake the House.

tenorly
(2,037 posts)But of course that would require amending the constitution, or at the very least getting legislatures in most large states to pass it - and the chances of that are slim to none.
packman
(16,296 posts)Knew Gerrymandering was bad for democracy, but had problem wrapping my head around it.


NRaleighLiberal
(60,281 posts)
wildeyed
(11,243 posts)I use it all the time on Twitter when moronic NC GOP operatives start pontificating about how they have a mandate to do anything they want because they have a veto proof majority. Um, no. With fair representation, they would have a slight edge in the general assembly but no power to override the Democratic governor's veto. This graphic is far easier than trying to explain that in 140 characters or less 
dsc
(52,462 posts)wildeyed
(11,243 posts)So infuriating! And then they GRIND it in our faces like they have an actual mandate. There is talk of tax revolt in Mecklenburg people are so mad. Urban areas are the economic engine of the state. Charlotte and Raleigh pay 40% of the taxes in the state and have almost no say in the GA. They cannot expect to completely disenfranchise us indefinitely without some serious consequences.
The backlash is coming. We will kick them out of the state house for another 100 years.

BSdetect
(9,039 posts)
mnhtnbb
(31,682 posts)NC is a pretty evenly divided state politically. We have 13 Congressional districts. Prior to the 2010 census and redistricting
by the Republicans (who gained control) the ratio was 7 Dems/6 Repubs. After the redistricting, the Repubs gained control
and they now have 10 Repubs/3 Dems Congressional Reps. Yet, in the 2016 election, if you just took the total number of votes
for Dem vs Repub Congressional Reps, there would be 7 Repubs/6 Dems. Yet, it is still 10 Repubs/3 Dems because of
the gerrymandering.
We are under a court order to redraw the districts. We can only hope it will be done, because the Repubs are doing everything
they possibly can to prevent it.
Republicans are scum. Just scum. They do not believe in democracy. They do not believe in equal rights. They only believe
in power to straight, white males and those that acknowledge that straight, white males are the only ones entitled to make decisions.
NewJeffCT
(56,833 posts)shift a few lines here and there and hope it lasts until after the 2018 midterms and rely on voter suppression to hold on to most of those 10 seats. But, if the new map results in a pickup of just one seat in NC and one seat in a few more states (WI, PA, TX, etc), it could mean a big difference in control of the House... before the usual midterm losses.
Right now, it's 193 Democrats, 242 Republicans. So, Democrats need to win 25 seats to take over the House.
If the courts strike down a bunch of gerrymandering laws, conservatively it's 198 to 237, so only a pickup of 20 seats is needed.
If the courts are more aggressive in striking down gerrymander laws, maybe Democrats pick up 10 seats and are now at 203 and need only 15 seats.

ncgrits
(916 posts)4th District David Price (D) is my representative. I live in Hillsborough and it's completely cut up between 4th (D) and 6th (R) districts.
 ?1454722075
mnhtnbb
(31,682 posts)BTW, David Price was seen at the March on Raleigh on Saturday.

ncgrits
(916 posts)I tried to get to his "town hall" at the library in Hillsborough a week or two back and there were no more "tickets"! Standing room only. Somehow I bet his reception was better than that of the repugs when they go back home!
Hey neighbor!

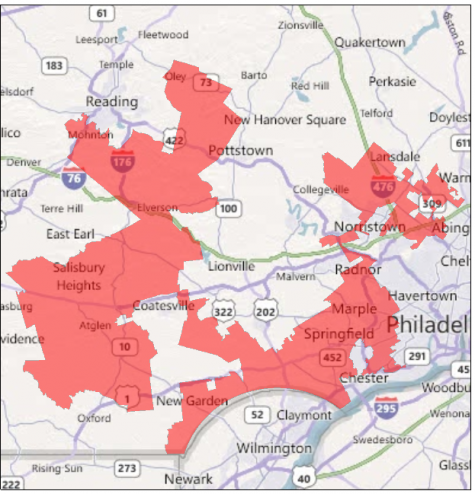
BumRushDaShow
(137,086 posts)Democratic voters outnumber GOP voters yet there are 13 GOP seats and only 5 Democratic seats.
You have atrocities like this here (7th Congressional) -
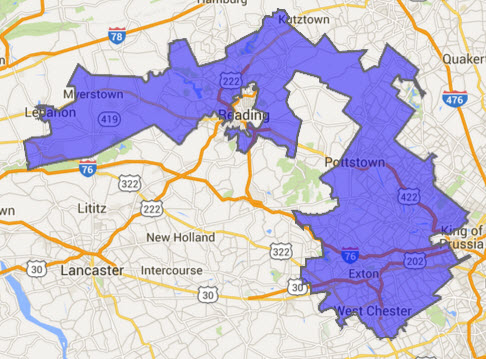
And this (6th Congressional) -
And this (12th Congressional) -


RoccoRyg
(260 posts)I learned in my college days that there are two forms of gerrymandering: cracking, where you split a certain group into separate districts to weaken their numbers, and packing, where you stuff as many of that group into few districts to weaken their vote in others. This graphic shows these sleazy practices perfectly. The blues in chart 3 have been cracked and packed in a meticulous attempt to ensure they are unequally misrepresented.
muriel_volestrangler
(102,047 posts)odd-shaped districts as if the geographical shape has suddenly become realistic. In practice, you don't get all red on one side, and all blue on the other.
Here's a map of 2004 voting, proportional to population size, and shades indicating county Repub/Demo voting:
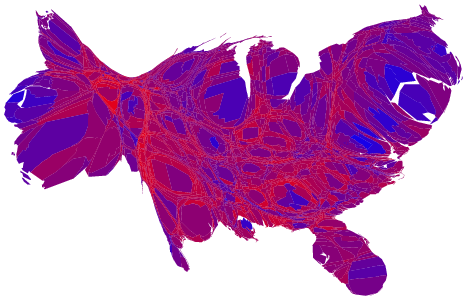
http://www-personal.umich.edu/~mejn/election/2004/

R B Garr
(17,300 posts)Excellent graphic.
aquamarina
(1,865 posts)MsUnderstood
(1,654 posts)A light bulb went off. . .and I checked my district. I have devin nunes, a tool of the trump administration. 1 mile south, I would have Jim Costa.
I wondered why so many people in my area were not more frustrated with nunes. Most of Fresno has a democratic Congressman--I have the Tulare wonder kid. And tulare county has a really low voter turnout (farmers and immigrants).
Gotta love Wiki for helping simplify this mess in California:
https://en.wikipedia.org/wiki/California's_congressional_districts

Dark n Stormy Knight
(9,960 posts)Taxation without representation. Fuck that shit.