Global warming 'hiatus' never happened, NOAA scientists say
Source: LA Times
Was it all really just an illusion?
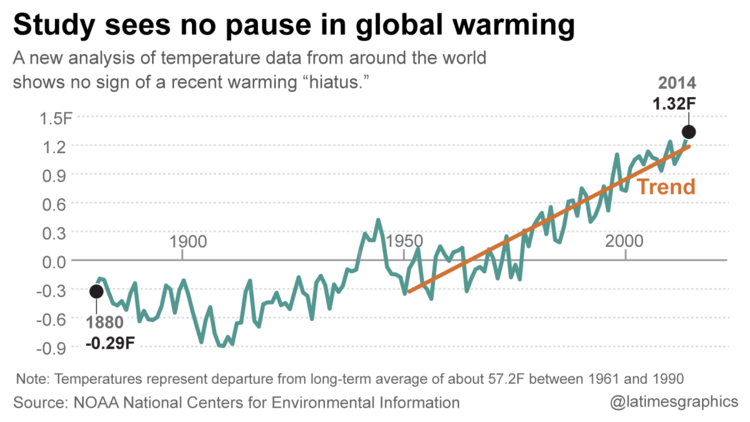
Ever since the Intergovernmental Panel on Climate Change acknowledged that the ominous rise in Earth’s mean surface temperature had begun to slow in 1998, scientists have struggled to explain this puzzling “pause” or “hiatus” in warming.
Some have argued that dust and ash blasted into the sky by Mt. Pinatubo and other volcanoes had reflected the sun’s heat back into space before it could be trapped by greenhouse gases. Others hypothesized that the sun had entered a rare period of calm, temporarily interrupting its habit of explosive tantrums.
Still more insisted this “missing” heat was absorbed by the Pacific Ocean, and other waters, and still lurks deep below the waves awaiting a stormy return to the surface.
Read more: http://www.latimes.com/science/sciencenow/la-sci-sn-no-global-warming-hiatus-noaa-20150603-story.html#page=1
 = new reply since forum marked as read
Highlight:
NoneDon't highlight anything
5 newestHighlight 5 most recent replies
= new reply since forum marked as read
Highlight:
NoneDon't highlight anything
5 newestHighlight 5 most recent replies

NRaleighLiberal
(60,018 posts)

DirtyHippyBastard
(217 posts)"
"
Peace Patriot
(24,010 posts)

Bill USA
(6,436 posts)I think this is important:
"An increasing number of climate scientists have argued that this cooling, as well as other hiatus effects, are evidence of a poorly understood pattern of wind, ocean current and temperature variations that exert far-reaching effects on climate."

daleanime
(17,796 posts)Buzz Clik
(38,437 posts)
Jack Rabbit
(45,984 posts)They've got quite a track record going.
They're either the worst liars since Gee Dubya (if not Pecos Bill) or the most willfully ignorant motherfuckers on earth.
7962
(11,841 posts)Regardless of how one feels about who's responsible for what, the NOAA just jiggered the numbers to get a different outcome. Which makes me take their reports less seriously.
http://wattsupwiththat.com/2015/06/04/noaancdcs-new-pause-buster-paper-a-laughable-attempt-to-create-warming-by-adjusting-past-data/
muriel_volestrangler
(101,348 posts)Watts gets funds from the Heartland Institute
https://en.wikipedia.org/wiki/Anthony_Watts_%28blogger%29#Connection_with_Heartland_Institute
No-one should be linking to that blog unless you're pointing out their misinformation.
7962
(11,841 posts)If you change the way you've always calculated the data in order to achieve a different outcome, you're just screwing around with the numbers. Thats what they did.
Sure, I think there is climate change going on. But I dont like it when our "experts" try their best to skew things to get the outcome they're looking for. They've become just as politicized as the other side has.
muriel_volestrangler
(101,348 posts)"in order to achieve a different outcome"
You've bought the right wing line that government scientists are in a conspiracy to make global warming look worse than it is. This is a scientific peer-reviewed paper.
http://www.sciencemag.org/content/early/2015/06/03/science.aaa5632.full
It comes from using more buoy, as opposed to ship, data, since that's more accurate; a realisation that some ships have, after all, still been using bucket measurements rather than the more common engine intake ones; and integrating a data set with improved coverage with the other data.
"our "experts" try their best to skew things to get the outcome they're looking for."
That's right wing bullshit. Yes, it does matter who funds people; 'our experts' are funded by the taxpayer via the government. They, and we, are not interested in exaggerating global warming, and your accusation that they "try their best to skew things to get the outcome they're looking for" is bollocks. We want to know the best scientific analysis and prediction we can get, so we can set policy. The fossil fuel industry that funds the Heartland Institute, on the other hand, want profit, right now, and do not care about the future of the planet. The Watts blog is permanently tainted by that outlook.
7962
(11,841 posts)And if you dont believe ANY of the stories of data being skewed or even altered any of the time, you're no different than the people who say nothing is going on. The emails exposing the discussion of how to change reports to make things look worse is proof enough. Its become way too political, as was expected. We are told we MUST make changes to slow change, yet not expect developing nations to do much of anything. Gotta let them "catch up". Well, bull. If the problem is worldwide, and it is, then ALL countries have to change. And as long as China and India keep doing what they do, nothing WE do will make a whit of a difference.
muriel_volestrangler
(101,348 posts)Of course it makes a difference - it's twice as much as India. And per capita emissions are the only fair way to set long term limits:
1.4 tonnes of carbon person-1yr-1 (5.1 tCO2) for the globe,
4.5 (16.4 tCO2) for the USA,
2.0 (7.2 tCO2) for China,
1.9 (6.8 tCO2) for the EU28,
and 0.5 (1.9 tCO2) for India.
So, yes, The USA has got a lot more to do than others.
What a load of wank. Are you referring to the non-story of "Climategate"? Every investigation, and there were several, showed there was no changing of reports to make things look worse. You're repeating the Republican bullshit. You may as well link to Inhofe's crap. You're making this political, by repeating Republican talking points. And you're burying your head in the sand with "nothing WE do will make a whit of a difference". Disgraceful.
7962
(11,841 posts)What it cares about is how much is being pumped into the air. And China pumps about 40% more than we do. Look at their pollution in the cities. They'll say they're going to do it, but they wont if it slows down their economy.
India is a bit more serious about it.
Imagine where the US would be with solar if Jimmy Carter's solar program had been kept going since the 70s!
muriel_volestrangler
(101,348 posts)If you're going to say that there are more Chinese than there are of you, and that means "nothing WE do will make a whit of a difference", that's the attitude of the careless 1%.
Yes, a solar program would have been great. Because it does matter what the USA does - and every country.
7962
(11,841 posts)I cant wait to see how it works for them! I want one too, but i need to wait till I'm in a more permanent location.
yellowcanine
(35,701 posts)Sorry but there is a sordid history of climate change deniers being funded by the energy industry. The line used to be that there is no global warming. Now, the line is that yes, there is warming but we cannot prove that it is caused by humans. That is known as "shifting the goal posts." "just as politicized" ???? In your (wet) dreams. Bottom line is that those working for the energy industry have a monetary incentive to interpret the data to show less warming - their financial backers will pull the plug if they don't. No such incentive is in place for most university and all government researchers. They get paid for doing the science, not for the results. Big difference.

tclambert
(11,087 posts)Here's how you can tell: If you start from 1999 instead (or 1997), the warming looks really dramatic. The whole problem is you don't do trend analysis by picking one value from a set of fluctuating values and draw a line from there to the end. You have to use running averages to smooth out the fluctuations.
1998 was the year of the strongest El Niño on record and thus, the largest upward fluctuation from the trend line on record. 1999 is a lot closer to the real trend line than 1998. 1999 was a little below the trend, and 1997 was quite a bit below the trend. 2014, on the other hand, set a new record high while falling almost right on the trend line. And 2014 had no El Niño. The other years warmer than 1998 (2005 and 2010) did have minor El Niños. 2015 started with a small El Niño, so expect a new record high for this year.

Igel
(35,337 posts)By both sides.
Early on the trend didn't show warming, so the "trend" was calculated over a fairly small interval. The beginning point was picked to maximize the slope and the interval stayed fairly constant--something like a decade.
Eventually the actual warming that was reported slowed and all but stopped. People tried to find a reason for it, and in the meantime the response was not let the interval continue to be a decadal window but instead to move the starting point back to produce ever-longer intervals. This included more time when there was significant warming. Since there was no "global cooling," this guaranteed that the flatlined portion would be merged with a portion with a fairly large slope. While the slope would be reduced from the earlier values, the slope was still obviously > 0.
Other problems could be handled by short-term anomalies--ENSO, Atlantic Oscillation, Arctic Oscillation, etc. When there was obvious warming, though, the very mechanism for warming *was* the appearance and duration of the anomalies.
In linguistics, it would be said that the theory was "too powerful." It not only predicted the data it had, and made predictions, but any deviation from the predictions could also be accounted for in a principled manner. In fact, nay-sayers denied such theories any theoretic-status: Any theory that can account for virtually any data doesn't deserve any scientific because it can't be falsified. There's a fine line between tweaking a theory to correct it and merely adding stuff to it to make it work: That fine line is principle. In a politicized environment--which is what, after all, linguistics is (it's a small world, but a political one)--admitting weakness is the same as defeat. The entire field of global warming is also political--both in ways that make the science pretentious and over-reaching as well as forcing the science to understate likely outcomes. (After all, they're absolutely rock-solid predictions. Of course, the previously absolutely rock-solid predictions were wrong. "Likely predictions" does not mean "certain", and when they're predictions they're only as good as the data, assumptions, and analysis.)
Psephos
(8,032 posts)muriel_volestrangler
(101,348 posts)"Early on the trend didn't show warming, so the "trend" was calculated over a fairly small interval. "
Give us years and the numbers for what you're talking about. 'Early on'? What, the 1890s? The 1950s? There's a graph in the OP, so tell us the years you mean, and give us an example of why '...so the "trend" ...', with scare quotes, is a valid thing to say - ie who said they did it over a small interval for that reason.
" The beginning point was picked to maximize the slope and the interval stayed fairly constant--something like a decade"
Who did that? How do you know they did it to 'to maximise the slope'?
"Eventually the actual warming that was reported slowed and all but stopped."
Who are you saying determines what the "actual" warming is, as opposed to some other kind of warming?
Your post is full of accusations of data massaging aimed against ... someone. Name the scientists you're accusing. Use some numbers.
DesMoinesDem
(1,569 posts)
tclambert
(11,087 posts)It's more like this chart from GISS, where the baseline (zero line) is 14.0 ̊ C. 1999 comes in at about 14.4 ̊, 1998 at 14.61 ̊ , 1997 at 14.45 ̊ , and 2014 comes in at 14.67 ̊. By starting at 1998, it looks the warming is only .06 ̊, but starting in 1997 or 1999, the warming is more than .2 ̊, which IS quite dramatic.
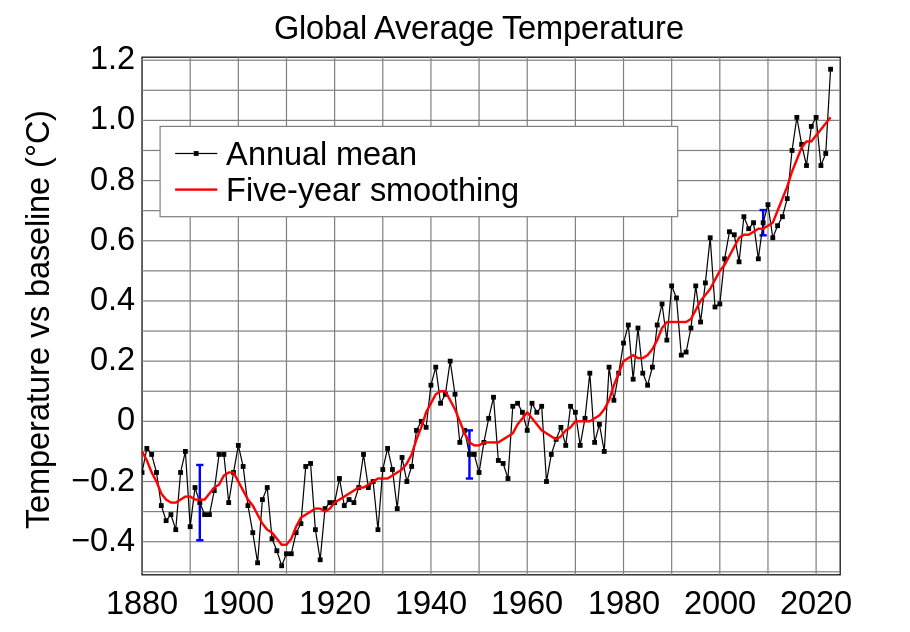
"Global Temperature Anomaly" by NASA Goddard Institute for Space Studies - http://data.giss.nasa.gov/gistemp/graphs/. Licensed under Public Domain via Wikimedia Commons - http://commons.wikimedia.org/wiki/File:Global_Temperature_Anomaly.svg#/media/File:Global_Temperature_Anomaly.svg
DesMoinesDem
(1,569 posts)the warming trend from 1997 and 1999 doesn't look "really dramatic" compared to 1998.

tclambert
(11,087 posts)When it comes to worldwide average annual temperature, .1 is drama. But MY bogus trend lines start at .4 and go up to .67, which is double terrible dramatic. My point was, you can draw bogus trend lines and get bogus results. By the way, I can tell your trend lines are bogus, because they are straight lines. The real trend analysis done by scientists at GISS uses 5-year running averages, and that makes slightly wavy lines. The averages mostly smooth out the yearly fluctuations, but don't completely wipe out the fluctuating nature of the data.
The second way I can tell your trend lines are bogus is I can count. Your graph contains multiple points for each year, doesn't make clear where exactly each year begins and ends, yet it is clear enough to see that most of the points for 1999 are below the trend line drawn on it, and most of the 2014 points are above the trend line. Whoever drew those lines got the math wrong.
On edit: Hold it! Wait, I think I see it. The bogus trend lines in the graphs you posted start with the January temperatures and bogusly treat that like it accurately represents the average for the whole year, thus doubling down on the bad trend analysis. Now that made me smile.
DesMoinesDem
(1,569 posts)Real trend lines are "slightly wavy lines". LOL. Yea, linear trends are unscientific! Except when NOAA uses them. Then they're fine. LOL
"Whoever drew those lines got the math wrong." Yea, the computer got the math wrong. Obviously you eyeballing a graph is better than a computer plotting real data. LOL
"The bogus trend lines in the graphs you posted start with the January temperatures and bogusly treat that like it accurately represents the average for the whole year, thus doubling down on the bad trend analysis. Now that made me smile." Um, they're monthly anomalies that start at the beginning of the year. For some reason you want to leave out months of the year.
Your post is full of so much ignorance I actually feel bad for you.
tclambert
(11,087 posts)You simply don't do trend analysis of fluctuating values by starting from one point and drawing a straight line to another point, ignoring the fluctuations in between. The graphs you showed were computerized only in that someone told the computer to draw a straight line from point 1 to point 2, ignoring everything in between. That is obvious from eyeballing it. They did not bother to calculate any averages.
As such, those graphs are clearly intended to deceive, as is the meme of "look at temperatures since 1998."
DesMoinesDem
(1,569 posts)You clearly have no idea what you are taking about.
"You simply don't do trend analysis of fluctuating values by starting from one point and drawing a straight line to another point, ignoring the fluctuations in between. ". LOL. If the data was just a straight line you wouldn't need a trendline.
"As such, those graphs are clearly intended to deceive, as is the meme of "look at temperatures since 1998." That's why you said look at the temperatures since 1997 and 1999 instead! It's dramatically different! I proved you wrong with two datasets and you started arguing about linear trend lines. That's pure ignorance.
Sorry, the data says you are wrong. You're arguing against science and basic statistics.
Psephos
(8,032 posts)Don't like the results, jigger the numbers. Weird how they always get jiggered in the direction of the researchers' political beliefs or in the interests of government.
Mixed bag here at best. True science welcomes attempts to prove hypotheses wrong, and treats skeptics as indispensable. The only science worth respect is that which can answer its critics with predictions that are verified by actual outcomes.
These numbers will please those who believe in ACC and embolden those who don't. Nobody wins.
Baclava
(12,047 posts)At the end of the last Ice Age, the Sahara Desert was just as dry and uninviting as it is today. But sandwiched between two periods of extreme dryness were a few millennia of plentiful rainfall and lush vegetation.
During these few thousand years, prehistoric humans left the congested Nile Valley and established settlements around rain pools, green valleys, and rivers.
•10,500 to 9,000 years ago: Monsoon rains begin sweeping into the Sahara, transforming the region into a habitable area swiftly settled by Nile Valley dwellers.
•9,000 to 7,300 years ago: Continued rains, vegetation growth, and animal migrations lead to well established human settlements, including the introduction of domesticated livestock such as sheep and goats.
•7,300 to 5,500 years ago: Retreating monsoonal rains initiate desiccation in the Egyptian Sahara, prompting humans to move to remaining habitable niches in Sudanese Sahara. The end of the rains and return of desert conditions throughout the Sahara after 5,500 coincides with population return to the Nile Valley and the beginning of pharaonic society.
http://www.livescience.com/4180-sahara-desert-lush-populated.html
7962
(11,841 posts)
n2doc
(47,953 posts)GliderGuider
(21,088 posts)As in, "May you live in interesting times, and come to the attention of important people."
It is heart-breaking to see such denialism on display here at DU. Even though I know that denial is the one thing humans are best at, it still makes me very sad to see my friends doing it.
n2doc
(47,953 posts)truebrit71
(20,805 posts)n/t
NickB79
(19,257 posts)After all, when long-time DU'ers are quoting guys like Mr. Watts and the Heartland Institute 
That there is any debate in that direction at all...All efforts should be at max speed to correct the problem.
More green industry...education in the basic sciences..etc.etc...and the most important?
Conservation..

sofa king
(10,857 posts)"I dunno what a hiatus is but the rest of that headline is telling me what I already know."
complendio
(14 posts)When in fact upwards trends such as the ones seen in the stock markets have some "Down" periods.

Big_Mike
(509 posts)I believe change occurs each and every day. Whether warming or cooling, the planet's climate is always changing.
I see two questions from this fact:
1. How much, if any, effect does human activity increase/decrease this change?
2. If human activity does increase/decrease this change, how do we mitigate the increase/decrease?
I know that many scientists believe that humans are increasing the rate of change in global temperatures, but how do we drill down to know precisely what needs to change and how do we accomplish that change? There have been untold changes recorded in history, from mini-ice ages to our current warming. Given the complexity of climate, how do we identify, beyond a 50/50 guesstimate, what is causing change?
Can anyone help me here?