Payroll employment increases by 228,000 in November; unemployment rate unchanged at 4.1%
Source: U. S. Bureau of Labor Statistics
Economic News Release USDL-17-1616
Employment Situation Summary
Transmission of material in this release is embargoed until 8:30 a.m. (EST) Friday, December 8, 2017
Technical information:
Household data: (202) 691-6378 * cpsinfo@bls.gov * www.bls.gov/cps
Establishment data: (202) 691-6555 * cesinfo@bls.gov * www.bls.gov/ces
Media contact: (202) 691-5902 * PressOffice@bls.gov
THE EMPLOYMENT SITUATION -- NOVEMBER 2017
Total nonfarm payroll employment increased by 228,000 in November, and the unemployment rate was unchanged at 4.1 percent, the U.S. Bureau of Labor Statistics reported today. Employment continued to trend up in professional and business services, manufacturing, and health care.
Household Survey Data
The unemployment rate held at 4.1 percent in November, and the number of unemployed persons was essentially unchanged at 6.6 million. Over the year, the unemployment rate and the number of unemployed persons were down by 0.5 percentage point and 799,000, respectively. (See table A-1.)
....
Establishment Survey Data
Total nonfarm payroll employment increased by 228,000 in November. Employment continued to trend up in professional and business services, manufacturing, and health care. Employment growth has averaged 174,000 per month thus far this year, compared with an average monthly gain of 187,000 in 2016. (See table B-1.)
Employment in professional and business services continued on an upward trend in November (+46,000). Over the past 12 months, the industry has added 548,000 jobs.
In November, manufacturing added 31,000 jobs. Within the industry, employment rose in machinery (+8,000), fabricated metal products (+7,000), computer and electronic products (+4,000), and plastics and rubber products (+4,000). Since a recent low in November 2016, manufacturing employment has increased by 189,000.
Health care added 30,000 jobs in November. Most of the gain occurred in ambulatory health care services (+25,000), which includes offices of physicians and outpatient care centers. Monthly employment growth in health care has averaged 24,000 thus far in 2017, compared with an average increase of 32,000 per month in 2016.
Within construction, employment among specialty trade contractors increased by 23,000 in November and by 132,000 over the year.
....
In November, average hourly earnings for all employees on private nonfarm payrolls rose by 5 cents to $26.55. Over the year, average hourly earnings have risen by 64 cents, or 2.5 percent. Average hourly earnings of private-sector production and nonsupervisory employees rose by 5 cents to $22.24 in November. (See tables B-3 and B-8.)
The change in total nonfarm payroll employment for September was revised up from +18,000 to +38,000, and the change for October was revised down from +261,000 to +244,000. With these revisions, employment gains in September and October combined were 3,000 more than previously reported. (Monthly revisions result from additional reports received from businesses and government agencies since the last published estimates and from the recalculation of seasonal factors.) After revisions, job gains have averaged 170,000 over the last 3 months.
_____________
The Employment Situation for December is scheduled to be released on Friday, January 5, 2018, at 8:30 a.m. (EST).
Read more: https://www.bls.gov/news.release/empsit.nr0.htm
Commissioner's statement:
https://www.bls.gov/news.release/jec.nr0.htm
* * * * *
I'm on dial-up at home. I'll be heading into work shortly. See ya.
 = new reply since forum marked as read
Highlight:
NoneDon't highlight anything
5 newestHighlight 5 most recent replies
= new reply since forum marked as read
Highlight:
NoneDon't highlight anything
5 newestHighlight 5 most recent replies

Kilgore
(1,733 posts)Folks with paychecks is always a good thing

mahatmakanejeeves
(57,425 posts)Last edited Fri Dec 8, 2017, 01:45 PM - Edit history (2)
So far the BLS's reports are strictly neutral. There was a Senate hearing for the commissioner-nominee a few days ago. What will happen when he gets in, no one can say.
Thanks for writing.
ETA, 12:45 p.m.:
Senate Hearings Today for Department of Education and Department of Labor Nominations

Fred Sanders
(23,946 posts)highmindedhavi
(355 posts)Nt

BumRushDaShow
(128,905 posts)
Interesting about the September revision, which doesn't really make it much better and wow for the revised big drop for October...
mahatmakanejeeves
(57,425 posts)I got up late (6:48 a.m.) and decided to post from home. Then I'd go into work.
Snow is on the way, forecast for tonight. It's snowing in Atlanta now, maybe?
#Snow in Atlanta. So global warming can’t be real! Also: it rained yesterday, so deserts can’t be real!
Link to tweet
BumRushDaShow
(128,905 posts)There was a post I saw yesterday from a DUer in San Antonio, TX and they were getting snow. We are forecast for some tomorrow here in Philly. Ugh. Couldn't catch much more than a snowflake here back when I was a kid in the late '60s/early '70s and now... 
mahatmakanejeeves
(57,425 posts)I figured, "they get snow in San Antonio?" Well, yeah, I guess they do.
Enjoy the weekend.

Norbert
(6,039 posts)...is still very high.
This used to be a BIg issue before 2017 but it isn't any more. I wonder why?

Bengus81
(6,931 posts)Fred Sanders
(23,946 posts)By the way, thanks Obama!

Marthe48
(16,949 posts)more good that President Obama's policies are directly responsible for that trump and the repug know-nothings, do-nothings will ruin.
It is a testament to President Obama's leadership that employment is holding strong through the travails of this last year.

Glimmer of Hope
(5,823 posts)mahatmakanejeeves
(57,425 posts)Division of Management Systems
Bureau of Labor Statistics
U.S. Department of Labor
2 Massachusetts Avenue, N.E., Room 4080
Washington, D.C., 20212-0001
E-mail: dataqa@bls.gov
Fax: (202) 691-5111
Complainants should:
Identify themselves and indicate where and how they can be reached;
Identify, as specifically as possible, the information in question;
Indicate how they are affected by the information about which they are complaining;
Carefully describe the nature of the complaint, including an explanation of why they believe the information does not comply with OMB, Departmental, or agency-specific guidelines; and
Describe the change requested and the reason why the agency should make the change.
Failure to include this information may result in a complainant not receiving a response to the complaint or greatly reducing the usefulness or timeliness of any response. Complainants should be aware that they bear the burden of establishing that they are affected persons and showing the need and justification for the correction they are seeking, including why the information being complained about does not comply with applicable guidelines.
By Eli Saslow
http://twitter.com/elisaslow
March 9, 2012
The release of employment numbers by the Bureau of Labor Statistics has long been a ritual in Washington, but lately it has turned into an obsession during an election year defined by economic instability. Once each month, a nondescript government agency compiles and releases 24 tables of economic data that have come to define the 2012 election and so much else. Republican presidential candidates turn the numbers into speeches. The president’s staff monitors how they affect his approval rating. The Federal Reserve reevaluates interest rates. Investors prepare for the stock market to rise or fall, sometimes swinging in value by $150 billion in the minutes after the report is released.
....
The raw data had arrived at the Bureau of Labor Statistics (BLS), like always, on Wednesday the week before the report’s release: millions of characters representing survey information from 55,000 households; and then, a few days later, monthly payroll data from 486,000 businesses. Kosanovich’s boss posted a two-page schedule on the office wall, detailing the tasks ahead for a team of more than 20 economists. They would be required to make a series of six deadlines. Their work would undergo 15 fact checks and then 15 clearance reviews. They would sit together in a windowless conference room and read aloud from their eventual creation, a three-page news release and 24 data tables, debating commas and verbs for hours on end.
They would do it all with absolute discretion during an eight-day security lockdown, signing confidentiality agreements each morning, encrypting their computers and locking data into a safe every time they walked 10 yards away to use a bathroom. “Is your workstation secure?” asked a sign in the hallway. They all remembered the last security miscue, in November 2008 — the accidental transmission of some data to one wire service a full 25 seconds before the report’s scheduled release, an incident that had necessitated a series of internal investigations and revisions.
“We always tape paper over the windows of the conference room or draw the shades,” Kosanovich said about her typical routine during a lockdown. She made a habit of refraining from answering phone calls or e-mails from unknown numbers and never discussing data outside her office. For eight days, nobody visited her team’s floor at BLS without a security clearance. The custodial staff did not empty their trash until the report was released.
....
mahatmakanejeeves
(57,425 posts)[center]Past Performance is Not a Guarantee of Future Results.[/center]
Nonetheless, what is important is not this month's results, but the trend. Let’s look at some earlier numbers:
ADP® (Automatic Data Processing), for employment in November 2017:
I didn't get around to it.
Bureau of Labor Statistics, for employment in October 2017:
Payroll employment rises by 261,000 in October; unemployment rate edges down to 4.1%
ADP® (Automatic Data Processing), for employment in October 2017:
ADP says 235,000 private-sector jobs added in October
Bureau of Labor Statistics, for employment in September 2017:
Unemployment rate falls to 4.2% in September; payroll employment changes little (-33,000)
ADP® (Automatic Data Processing), for employment in September 2017:
Companies Add Fewest U.S. Workers in Nearly a Year, ADP Says
Bureau of Labor Statistics, for employment in August 2017:
Payroll employment increases by 156,000 in August; unemployment rate changes little (4.4%)
ADP® (Automatic Data Processing), for employment in August 2017:
Private-sector job growth surges in August with a little Amazon assist, ADP says
Bureau of Labor Statistics, for employment in July 2017:
Payroll employment increases by 209,000 in July; unemployment rate changes little at 4.3%
ADP® (Automatic Data Processing), for employment in July 2017:
U.S. private sector adds 178,000 jobs in July: ADP
Bureau of Labor Statistics, for employment in June 2017:
Payroll employment rises by 222,000 in June; unemployment rate changes little at 4.4%
ADP® (Automatic Data Processing), for employment in June 2017:
ADP Data on Private Hiring Suggest U.S. Job Market Is Moderating
Bureau of Labor Statistics, for employment in May 2017:
Payroll employment rises by 138,000 in May; unemployment rate changes little (4.3%)
ADP® (Automatic Data Processing), for employment in May 2017:
U.S. companies add 253,000 jobs in May: ADP
Bureau of Labor Statistics, for employment in April 2017:
Payroll employment rises by 211,000 in April; unemployment rate changes little at 4.4%
ADP® (Automatic Data Processing), for employment in April 2017:
Private-sector hiring slowest in four months, ADP says
Bureau of Labor Statistics, for employment in March 2017:
Unemployment rate declines to 4.5 percent in March; payroll employment edges up by 98,000
ADP® (Automatic Data Processing), for employment in March 2017:
Private sector adds 263,000 jobs in March: ADP
Bureau of Labor Statistics, for employment in February 2017:
Payroll employment rises by 235,000 in February; unemployment rate changes little at 4.7%
ADP® (Automatic Data Processing), for employment in February 2017:
ADP National Employment Report: Private Sector Employment Increased by 298,000 Jobs in February
Bureau of Labor Statistics, for employment in January 2017:
Payroll employment rises by 227,000 in January; unemployment rate changes little (4.8%)
ADP® (Automatic Data Processing), for employment in January 2017:
ADP National Employment Report: Private Sector Employment Increased by 246,000 Jobs in January
Bureau of Labor Statistics, for employment in December 2016:
Payroll employment rises by 156,000 in December; unemployment rate changes little (4.7%)
ADP® (Automatic Data Processing), for employment in December 2016:
Private hiring slows in December, jobs market still solid
Bureau of Labor Statistics, for employment in November 2016:
Unemployment rate declines to 4.6% in November; payroll employment increases by 178,000

ProfessorGAC
(65,010 posts)Did they forget to exclude people who retired in November or something?
If 228k jobs were added, that is 0.07% of the entire population of the United States.
Since only a reasonably large fraction of the population is in the workforce, the proportion increases by about 1.7, to 0.119%.
Hence UE should have gone down by that, which is statistically significant.
Of course, the population could have increased by 380,000 people but that would be 4.5 million a year, which is a population growth rate of 1.37% per year. That seems high.
But, how can 6.6 million people unemployed be the same percentage if the population in the workforce went up?
This is pretty straightforward algebra and the numbers aren't squaring in this report.

progree
(10,904 posts)The 228k jobs is from the Establishment Survey.
The unemployment rate, the number of employed and unemployed, labor participation rate and civilian labor force and civilian non-institutional population and more is from the Household Survey.
The number of employed (Household Survey) went up by only 57,000 -- yes, way different than the 228,000 in the Establishment Survey. Monthly changes in the Household Survey are extremely volatile. It is common for the two surveys to be radically different in month-to-month changes, although over time they average out to be about the same (well, currently the Employed is 153,918,000 which is 4.5% higher than the 147,241,000 establishment survey number of employees)
The number of unemployed went up by 90,000.
The civilian labor force = employed + unemployed. It went up by 57,000 + 90,000 = 147,000. Well, they say the civilian labor force went up by 148,000 -- figures don't add up exactly due to rounding.
The unemployment rate = unemployed / civilian labor force.
Table A has some of the key numbers in the Household Survey. Table B has some of the key numbers in the Establishment Survey.
http://www.bls.gov/news.release/pdf/empsit.pdf
ProfessorGAC
(65,010 posts)Given large sample size.
So, the UE not changing still doesn't make sense
Good reply BTW
progree
(10,904 posts)Last edited Sat Dec 9, 2017, 10:37 AM - Edit history (3)
Unemployment rate = Unemployed/Civilian Labor Force:
October unemployment rate is 6,520,000/160,381,000 = 4.065% -> rounds to 4.1%
November unemployment rate is 6,610,000/160,529,000 = 4.118% -> rounds to 4.1%
That they are "statistically significant" doesn't mean they aren't very volatile with a huge margin of error.
On statistical noise, I found this BLS technical note on sampling error -- http://www.bls.gov/news.release/empsit.tn.htm . Based on what it says, there is a 90% probability that the Establishment Survey's non-farm employment increase is within +/- 120,000 of the stated number. And a 10% chance that it is off by more than 120,000.
And in the Household Survey, there is a 90% chance that the monthly unemployment change is +/- 300,000 of the stated number (note this is 2.5 times the Establishment Survey's employment's sampling error). Also, that there is a 90% chance that the unemployment rate is about +/- 0.2% of the stated number.
Given that November's unemployment change was +90,000, that means there is a 90% chance, based on sampling error alone, that the unemployment change is somewhere between -210,000 and +390,000.
The above only covers sampling error. There are also many other sources of error (search the above link for "non-sampling error" )
Here are the monthly changes in the Employed from the Household Survey, in thousands:
http://data.bls.gov/timeseries/LNS12000000
2016: 503 510 258 -273 30 32 456 109 271 -24 146 63
2017: -30 447 472 156 -233 245 345 -74 906 -484 57
January and February data are affected by changes in population controls.
Notice how it bounces around -- not surprising with statistical sampling error alone being +/- 300,000 (for the unemployed -- I don't know what it is for the employed ).

Ignoring monthly changes in January and February, the population controls adjustment months, and leaving out the two outliers: -484,000 and +906,000, it bounces around between about -250,000 and +500,000
This is the non-farm employee count from the Establishment Survey, in thousands
https://data.bls.gov/timeseries/CES0000000001
2016: 126 237 225 153 43 297 291 176 249 124 164 155
2017: 216 232 50 207 145 210 138 208 38 244(P) 228(P)
(P): Preliminary

With the much larger sample size of the Establishment Survey, and again throwing out the two outliers: +38,000 and +297,000, the monthly changes are much smoother, varying between about +40,000 and +290,000
ProfessorGAC
(65,010 posts)...in Applied Math (after my advanced degree in chemistry) I question the methodology then!
mahatmakanejeeves
(57,425 posts)I used to run this every month in the commentary in the zeroeth post. It explains just about every aspect of the monthly report.
[center]Facilities for Sensory Impaired[/center]
Information from this release will be made available to sensory impaired individuals upon request. Voice phone: 202-691-5200, Federal Relay Services: 1-800-877-8339.
[center]Introduction[/center]
Good morning, Freepers and DUers alike. I especially welcome our good friends from across the aisle. You're paying for this information too, so I am absolutely delighted to have you participate in this thread. Please, everyone, put aside your differences long enough to digest the information. After that, you can engage in your usual donnybrook.
Full disclosure: I do not work for BLS, nor am I friends with anyone over there. I'm just someone who appreciates the work they do. My sole connection with the agency is that I've been in the building to pick up some publications.
Thank you for being a part of this thread.
If you don't have the time to study the report thoroughly, here is the news in a nutshell:
Commissioner's Statement on The Employment Situation
It is easy to find one paragraph, or one sentence, or one datum in this report that will support the most outlandish of conclusions, from "the sky is falling" to "we'll have blue skies, nothing but blue skies, from now on." Easy, but disingenuous.
Every month, you can find something in the report that will cause you concern. Take the information in context. Consider not just this month’s data, but the trend.
Please take the time to look at progree's not-to-be-missed thread containing his thoughtful analysis, updated monthly. Here is the latest version:
Economy facts with links to official sources, rev 8/5/16.
Thank you so much for that, progree.
Let's begin with a couple of questions:
[center]What Is the Bureau of Labor Statistics?
Why Does It Release All These Numbers Every Month?[/center]
The BLS data must satisfy a number of criteria, including relevance to current social and economic issues, timeliness in reflecting today’s rapidly changing economic conditions, accuracy and consistently high statistical quality, and impartiality in both subject matter and presentation. To avoid the appearance of partiality, the dates of major data releases are scheduled more than a year in advance, in coordination with the Office of Management and Budget.
[font color="red"]New material, added August 29, 2016:[/font] Print title, Washington Post, Saturday, March 10, 2012, front page, above the fold: "Watching the clock: Monthly data release is an economic, political obsession timed to the nanosecond"
By Eli Saslow
http://twitter.com/elisaslow
March 9, 2012
The release of employment numbers by the Bureau of Labor Statistics has long been a ritual in Washington, but lately it has turned into an obsession during an election year defined by economic instability. Once each month, a nondescript government agency compiles and releases 24 tables of economic data that have come to define the 2012 election and so much else. Republican presidential candidates turn the numbers into speeches. The president’s staff monitors how they affect his approval rating. The Federal Reserve reevaluates interest rates. Investors prepare for the stock market to rise or fall, sometimes swinging in value by $150 billion in the minutes after the report is released.
....
The raw data had arrived at the Bureau of Labor Statistics (BLS), like always, on Wednesday the week before the report’s release: millions of characters representing survey information from 55,000 households; and then, a few days later, monthly payroll data from 486,000 businesses. Kosanovich’s boss posted a two-page schedule on the office wall, detailing the tasks ahead for a team of more than 20 economists. They would be required to make a series of six deadlines. Their work would undergo 15 fact checks and then 15 clearance reviews. They would sit together in a windowless conference room and read aloud from their eventual creation, a three-page news release and 24 data tables, debating commas and verbs for hours on end.
They would do it all with absolute discretion during an eight-day security lockdown, signing confidentiality agreements each morning, encrypting their computers and locking data into a safe every time they walked 10 yards away to use a bathroom. “Is your workstation secure?” asked a sign in the hallway. They all remembered the last security miscue, in November 2008 — the accidental transmission of some data to one wire service a full 25 seconds before the report’s scheduled release, an incident that had necessitated a series of internal investigations and revisions.
“We always tape paper over the windows of the conference room or draw the shades,” Kosanovich said about her typical routine during a lockdown. She made a habit of refraining from answering phone calls or e-mails from unknown numbers and never discussing data outside her office. For eight days, nobody visited her team’s floor at BLS without a security clearance. The custodial staff did not empty their trash until the report was released.
....
[center]Household Survey vs. Establishment Survey[/center]
From the February 10, 2011, DOL Newsletter:
Secretary Solis answers three questions about how the Bureau of Labor Statistics calculates unemployment rates.
How does BLS determine the unemployment rate and the number of jobs that were added each month?
BLS uses two different surveys to get these numbers. The household survey, or Current Population Survey (CPS), involves asking people, from about 60,000 households, a series of questions to assess each person in the household's activities including work and searching for work. Their responses give us the unemployment rate. The establishment survey, or Current Employment Statistics (CES), surveys 140,000 employers about how many people they have on their payrolls. These results determine the number of jobs being added or lost.
[center]Complaint Department[/center]
I post this information on a nonpartisan basis. I am not here to make elected officials of any party or persuasion look good. I am certain that the people who compile these data are of the same outlook. They are civil servants. They do not work for a party; they work for you, the American people.
My only contribution is to cut and paste a few paragraphs from the BLS and then, in the commentary, link to some sources that I feel are trustworthy. I hope people come away with a better understanding of the data after reading this thread. Once again, I do not work for BLS, but I will nonetheless try to assist if I can.
If you feel the Bureau of Labor Statistics is handing out bunk, start here:
Point of Contact for Complaints Concerning Information Quality
Division of Management Systems
Bureau of Labor Statistics
U.S. Department of Labor
2 Massachusetts Avenue, N.E., Room 4080
Washington, D.C., 20212-0001
E-mail: dataqa@bls.gov
Fax: (202) 691-5111
Complainants should:
Identify themselves and indicate where and how they can be reached;
Identify, as specifically as possible, the information in question;
Indicate how they are affected by the information about which they are complaining;
Carefully describe the nature of the complaint, including an explanation of why they believe the information does not comply with OMB, Departmental, or agency-specific guidelines; and
Describe the change requested and the reason why the agency should make the change.
Failure to include this information may result in a complainant not receiving a response to the complaint or greatly reducing the usefulness or timeliness of any response. Complainants should be aware that they bear the burden of establishing that they are affected persons and showing the need and justification for the correction they are seeking, including why the information being complained about does not comply with applicable guidelines.
[font color="red"]New material, added July 8, 2017:[/font]
By Ezra Klein January 13, 2012
....
But it would be even better if voters had a consistent benchmark for judging a president’s performance. The question — and it’s a tough one — is how to separate the very real influence the president has on the economy from the myriad other factors that weigh on whether consumers spend and businesses hire. So I put the issue to an exclusive club of economists who have an unusually fine-grained understanding of what the president can and can’t do: the former chairs of the president’s Council of Economic Advisers. And I asked each the same question: How much of national job creation during a presidency can we properly attribute to the president?
“Very little,” wrote Harvard’s Martin Feldstein in an e-mail. Feldstein led the CEA under Reagan, and he didn’t see much role for the president in normal economic times. “The key is growth of population and labor force participation. Policy — primarily monetary policy — affects cyclical conditions and therefore the unemployment rate. Fiscal policy is usually irrelevant but with interest rates at the current level there has been a role for fiscal policy.”
Laura D’Andrea Tyson, a Berkeley economist who served under President Clinton, emphasized the need to consider timing in our evaluations. “There are significant lags between the time a President proposes a policy, the time it is enacted by Congress and the time necessary for it to take effect,” she wrote to me. “These lags should be taken into account in measuring the economy’s job performance under a President. The first year probably should not count at all in terms of assessing the effects of a new Administration’s policies.”
Greg Mankiw, a Harvard economist who served as CEA chair under George W. Bush, directed me to a blog post he had written on the subject. “Randomness is a fact of economic life,” Mankiw wrote, “and it would be a mistake to judge a president by the economic outcome during his administration. It is better to look at the decisions the president made, and to acknowledge that the outcome is a function of those decisions and many other factors not under his control. As an economist, I have views about what best practices are for economic policy, and I judge presidents by how closely they adhere to those principles.” ... “Unfortunately,” he concluded, “that evaluation process is not quite as simple and objective as the reader might have hoped for. But I don’t think there is a better alternative.”
....
kleine@washpost.com
https://twitter.com/ezraklein
[center]How Do You Define Unemployment?
The Large Print Giveth, and the Fine Print Taketh Away.[/center]
Long ago, a DUer pointed out that, if I'm going to post the link to the press release, I should include the link to all the tables that provide additional ways of examining the data. Specifically, I should post a link to Table A-15. Alternative measures of labor underutilization. Table A-15 includes those who are not considered unemployed, on the grounds that they have become discouraged about the prospects of finding a job and have given up looking. Here is that link:
Table A-15. Alternative measures of labor underutilization
Also, hat tip, Recursion: How the Government Measures Unemployment
[font color="red"]New material, added August 8, 2016:[/font]
This appeared at the top of page A2 in the Wednesday, July 27, 2016, print edition of The Wall Street Journal. as "Jobless Picture is Open to Interpretation."
Gauges used to measure unemployment vary in how they define who is out of work {print: "Political campaigns clash over different ways of measuring unemployment"}

By Josh Zumbrun
josh.zumbrun@wsj.com
@JoshZumbrun
July 26, 2016 7:56 p.m. ET
Because political campaigns can rise and fall on the health of the economy, spats often flare over the gauges used to measure growth and unemployment.
The latest dust-up, raised by the campaign of Republican presidential nominee Donald Trump, focuses on the monthly employment numbers. A long streak of hiring has nudged the jobless rate down to 4.9%. ... Donald Trump Jr., the nominee’s son, recently criticized the official statistics as “artificial numbers…massaged to make the existing economy look good.”
The nominee himself has said unemployment is far higher than the Labor Department’s headline 4.9% rate would suggest, part of his message that the economy is in a dire state. After he won the New Hampshire primary in February, Mr. Trump called the official jobless figures “phony” and said the real number could be as high as 42%.
This isn’t the first time people have cast aspersions on the jobs numbers in an election year, but the Trump claim is also part of a larger discussion over how best to assess the health of the labor market.
The following link to Barron's might not work for everyone. See progree's tips.[/font] From the July 20, 2015, issue of Barron's:
Refresher Course: Inside the Jobless Numbers
By Gene Epstein
July 18, 2015
The unemployment rate has never been the object of as much attention from the markets and the media as it is now, sparked by the keen interest taken in its monthly fluctuations by policy makers at the Federal Reserve.
Despite the heightened focus, there are a lot of misunderstandings and misconceptions about how the rate is calculated. Some people assume the Bureau of Labor Statistics compiles the rate from the unemployment-insurance rolls. On that basis, they fault the BLS for undercounting the unemployed. But that’s just one myth among many about this cornerstone measure of economic pain and labor-market slack.
To estimate the unemployment rate, the BLS actually relies on the monthly Current Population Survey conducted for it by the Census Bureau. While the data are highly imperfect in their own way, we think the Federal Reserve is right to view the official unemployment rate as the best available information, while also keeping its eye on ancillary measures of “labor underutilization.”
In fact, a close look at BLS methods suggests that, if anything, the official unemployment rate may be overcounting rather than undercounting the unemployed.

[font color="red"]New material:[/font] In August 2015, DUers whatthehey and progree got into a 1995 report from economists John E. Bregger and Steven E. Haugen. The .pdf is unfortunately an image and thus challenging as a source of quotes. Trying to find it in a format that does make for easy copying, I was led to this:
Alternative Unemployment Rates: Their Meaning and Their Measure March 12, 2014
[center]Why Won't You Talk About the Labor Force Participation Rate (LFPR)?[/center]
Every month in certain circles, someone will cite the labor force participation rate as a cause for concern. Let's look at that right now.
[font color="red"]New material, added September 30, 2016:[/font]
Labor force participation: what has happened since the peak?
The labor force participation rate is the percentage of the civilian noninstitutional population 16 years and older that is working or actively looking for work. It is an important labor market measure because it represents the relative amount of labor resources available for the production of goods and services. After rising for more than three decades, the overall labor force participation rate peaked in early 2000 and subsequently trended down. In recent years, the movement of the baby-boom population into age groups that generally exhibit low labor force participation has contributed to the decline in the overall participation rate. From 2000 to 2015, most of the major demographic groups saw a decrease in labor force participation. Teenagers experienced the largest drop in participation, which coincided with a rise in their school enrollment rate. Young adults 20 to 24 years also showed a decline in labor force participation, but the decrease was not as steep as that for teenagers. The labor force participation rate of women 25 to 54 years also fell, with the decrease more pronounced for women who did not attend college. The labor force participation rate of men 25 to 54 years continued its long-term decline. As in the past, the decrease in participation among men with less education was greater than that of men with more education. However, labor force participation rates of men and women 55 years and older rose from 2000 to 2009 and subsequently leveled off.
[font color="red"]New material, added July 31, 2016:[/font]
Title in the print edition of the Washington Post, page A17, Wednesday, July 27, 2016: "The unemployment-rate 'conspiracy' that isn't"
By Matt O'Brien July 26
matthew.obrien@washpost.com
@ObsoleteDogma
The unemployment rate is not a conspiracy. It is not manipulated by the Bureau of Labor Statistics. And anyone who suggests otherwise is either uninformed, or trying to misinform others.
Which is to say that you shouldn't listen to Donald Trump & Co. For a year now, the alleged billionaire has insisted that the "real" unemployment rate is something like 42 percent instead of the 4.9 percent it actually is. He hasn't said how he's gotten this — maybe it's from the same "Link to tweet
" target="_blank">extremely credible source" who told him President Obama's birth certificate was fake? — but the simplest explanation is that he's just ballparking how many adults don't work. That's 40.4 percent right now. The problem with using that number, though, is that it counts college students and stay-at-home parents and retirees as being equally "unemployed" as people who are actively looking for work but can't find any. So it doesn't tell us too much, at least not on its own, unless you think it's a problem that we have more 70-year-olds than we used to.
Or unless conspiracy theories are one of your favorite accessories, as seems to be the case with the father, and now the son, Donald Trump Jr. On Sunday, he told CNN's Jake Tapper that the official unemployment numbers are "artificial" ones that are "massaged to make the existing economy look good" and "this administration look good."
....

Source: BLS
....
The boring truth is that the economy is in a lot better shape than it was when Obama took office, but that it could be in better shape still. The recovery, in other words, still has a ways to go. But that's a lot different from saying that we have 40 percent unemployment and that the government is trying to cover it up. That just suggests you don't understand — or don't want to accurately describe — how stats work and you don't know how to look up the ones you think the BLS is hiding. ... It's not what you'd expect from a major party presidential candidate.
[font color="red"]New material, added June 27, 2016:[/font]
[link:https://www.washingtonpost.com/news/wonk/wp/2016/06/20/why-americas-men-arent-working/|
Why America’s men aren’t working]
By Ylan Q. Mui June 20
The national unemployment rate has fallen by more than half since the nation emerged from the worst economic crisis since the Great Depression. It peaked at 10 percent in 2010 and stood at just 4.7 percent last month.
That’s mostly good news: Private employers have added more than 14 million jobs. About 2 million people have been out of a job for six months or longer, far too many but only about a quarter of the number of long-term unemployed people seven years ago. By almost every measure, the labor market has made incredible progress.
But there’s one statistic that has been vexing economists. The size of the nation’s workforce -- known as the labor force participation rate -- continues to fall. Since the start of the downturn, the percentage of that population that has a job or is looking for one has dropped more than 3 percentage points, to 62.6 percent, a level not seen since the 1970s.
{America’s jobs market has had a great 2016. Will it last?}
The problem is particularly pronounced among men between the ages of 25 and 54, traditionally considered the prime working years. Their participation rate has been declining for decades, but the drop-off accelerated during the recession. The high mark was 98 percent in 1954, and it now stands at 88 percent. A new analysis from the White House’s Council of Economic Advisers, slated for release Monday, found that the United States now has the third-lowest participation rate for “prime-age men” among the world’s developed countries.
....

....
People in prison are not counted as part of the population for the purposes of labor market statistics. At first blush, that would actually boost the participation rate: A smaller population means the share in the workforce is larger. But in reality, there are immense and well-documented barriers to the job market for workers once they leave prison. And the gloomy prospects of the formerly incarcerated outweigh the statistical benefit of having a large prison population.

....
Ylan Q. Mui is a financial reporter at The Washington Post covering the Federal Reserve and the economy. Follow @ylanmui
[font color="red"]New material, added January 2016:[/font] People who are not in the labor force: why aren't they working?
December 2015 | Vol. 4 / No. 15
EMPLOYMENT & UNEMPLOYMENT
People who are not in the labor force: why aren't they working?
By Steven F. Hipple
People who are neither working nor looking for work are counted as “not in the labor force,” according to the U.S. Bureau of Labor Statistics. Since 2000, the percentage of people in this group has increased. Data from the Current Population Survey (CPS) and its Annual Social and Economic Supplement (ASEC) provide some insight into why people are not in the labor force. The ASEC is conducted in the months of February through April and includes questions about work and other activities in the previous calendar year. For example, data collected in 2015 are for the 2014 calendar year, and data collected in 2005 are for the 2004 calendar year.1 In the ASEC, people who did not work at all in the previous year are asked to give the main reason they did not work. Interviewers categorize survey participants’ verbatim responses into the following categories: ill health or disabled; retired;2 home responsibilities; going to school; could not find work;3 and other reasons.
This Beyond the Numbers article examines data on those who were not in the labor force during 2004 and 2014 and the reasons they gave for not working. The data are limited to people who neither worked nor looked for work during the previous year.
This July 2014 report from the Council of Economic Advisers addresses the LFPR:
THE LABOR FORCE PARTICIPATION RATE SINCE 2007: CAUSES AND POLICY IMPLICATIONS
(Hat tip, Adrahil: Look deeper.)
[font color="red"]New material:[/font] Here's a Power Point (or equivalent) presentation given by Jason Furman, Chairman of the Council of Economic Advisers, before the National Press Club on August 6, 2015. If you go to the next-to-the-last slide, you'll see that the long-term projected trend is down:
"Trends in Labor Force Participation", 8/6/15
(Hat tip, progree: Over the past month, over the past year, and since February 2010)
[font color="red"]New material:[/font] Paul Vigna had a comment about the LFPR in the December 4, 2015, MoneyBeat column about the November figures:
Breaking down the participation rate
by Paul Vigna
Here’s what we mean when we talk about the participation rate and employment-population ratio.
There are 251.7 million people in the “civilian noninstitutional population,” according to the BLS (this is all contained in this chart). This is the number of people over age 16 who are not in jail or health-care facilities or the military.
Of that group, 157.3 million comprise the civilian labor force. The ratio of the second group to the first is 62.5%. This is the labor force participation rate, the number of people who could be in the labor force – either working or looking for a job – who are in the labor force.
There are 149.3 million people working. The ratio of that group to the overall civilian population is 59.3%. This the employment-population ratio, the number of people who could be working who actually are working.
Why do these number matter? Well, if you just looked at the raw data, you’d see the numbers rising, more or less, month after month. That’s not because the economy’s so rip-roaring, but because the number of people in the nation keeps rising. So you need the ratios to get a sense of how strong the labor force really is.
The labor-force participation rate remains near multi-decade lows, and whether that’s due to demographics, as in people retiring, or weak job opportunities, or whatever, it points to one sort of unavoidable problem: the economy cannot grow at its full potential if you simply don’t have enough people contributing.
Oh, and for the record, there are 94.4 million people not in the labor force.
[font color="red"]New material, added December 2015:[/font]
Dec 8, 2015
economics
As America’s Workforce Ages, Here’s Where the Jobs Will Be
By Jeffrey Sparshott
Jeffrey.Sparshott@wsj.com
@jeffsparshott
The U.S. labor force is expected to expand only slowly over the coming decade as the country ages and more Americans give up on holding a job, a potential drag on broader economic growth.
The economy is expected to generate 9.8 million new jobs, a 6.5% increase, from 2014 to 2024, the Labor Department said in new projections released Tuesday. While steady, that is a historically slow pace. By comparison, 10-year job creation averaged almost 14% during the 2001-07 expansion and close to 17% during the 1990s.
The slowdown highlights declining participation as baby boomers retire and younger Americans opt out of the workforce. Those two trends are expected to continue to push the labor-force participation rate lower, to 60.9% in 2024 from 62.9% in 2014, Labor estimates. If realized, that would be the lowest level since 1973, when Richard Nixon was president.
Federal Reserve Chairwoman Janet Yellen at a congressional hearing last week held out hope the participation rate would hold near current levels as people came off the sidelines and into jobs.
[center]Nattering Nabobs of Negativism[/center]
[font color="red"]New material, added February 26, 2016:[/font] More High-Wage Employment Doesn't Mean the Job Market's Out of the Woods
That's the print edition title.
The recovery is generating more high-wage jobs — but does that matter?
The U.S. is still digging out of a big hole, and isn't creating new opportunities for those whose jobs disappeared.
By Lydia DePillis February 24
@lydiadepillis
A couple of weeks ago, some economists from Goldman Sachs came out with a rosy pronouncement: "Millions of new jobs and plenty of good ones," read the headline on a note to investors. High-wage employment appeared to pick up from 2013 to the present, a change from the early years of the economic recovery, which generated a disproportionate number of low-wage jobs.

And you don’t have to just take it from an investment bank. The Department of Labor has run its own numbers, and saw similar growth back in October, rendered in absolute numbers rather than growth rates (which Labor’s Chief Economist Heidi Shierholz says held through the end of 2015 in an analysis the department completed last week).
The green bars in the graph below show changes in actual employment, and the orange line shows what it would have been if the growth had been evenly distributed. Shierholz says the loss of low-wage jobs is likely a result of workers in those categories having their wages bumped up above $10 an hour, as the huge growth in low-wage sectors from 2009-2013 led to competition for people in restaurants and retail, or finding better jobs.

That renewed growth in high-wage jobs, which started to show up in 2014, is typical of recoveries from recessions: Low-wage retail and restaurant jobs come back first, as consumers start to buy small-ticket items and go out to eat again. Later on, the profitability trickles up, leading firms to make more expensive hires. Overall, the trend could be responsible for the small uptick in wages that's become evident in recent months, as well.
[font color="red"]Revised material:[/font] Here’s a grim thought:
Fed economists: America’s missing workers are not coming back
By Max Ehrenfreund September 12 {2014}
A paper by Federal Reserve staff that will be discussed at the Brookings Institution on Friday {September 12, 2014} possibly hints at the central bank's thinking on interest rates and employment in advance of a consequential Fed meeting next week. The findings support [links:http://online.wsj.com/articles/fed-minutes-rate-hike-debate-heating-up-1408557628|hawks] on the Federal Open Market Committee, who feel that the Fed needs to prepare to raise rates sooner than expected, although the results are still being debated and might not persuade the committee's more dovish members.
The paper discusses the number of people who consider themselves part of the workforce -- including both people who have a job and those who are looking for work. It is a measure of the total manpower available in the U.S. economy. This number, the labor force participation rate, has been decreasing steadily since 2000. Americans who can't find work have been leaving the workforce, as have more and more retirees as the population ages.
Let’s follow that with another grim thought:
Why wage growth disparity tells the story of America's half-formed economic recovery
chico.harlan@washpost.com
@chicoharlan
....
With unemployment down to 5.8 percent, the country’s half-formed recovery is often described with a convenient shorthand: We have jobs but little wage growth. But stagnancy is just an average, and for many Americans, the years since the financial crisis have pushed them farther from the line, according to a detailed analysis of government labor statistics by The Washington Post.
....
Among the winners in this climate: Older workers, women and those with finance and technology jobs. ... Among the losers: Part-timers, the young, men, and those in the health, retail and food industries.
....
Chico Harlan covers personal economics as part of The Post's financial team.
Dissenters, take note:
A New Reason to Question the Official Unemployment Rate
AUG. 26, 2014
The Labor Department’s monthly jobs report has been the subject of some wacky conspiracy theories. None was wackier than the suggestion from Jack Welch, the former General Electric chief executive, that government statisticians were exaggerating job growth during President Obama’s 2012 re-election campaign. Both Republican and Democratic economists dismissed those charges as silly.
But to call the people who compile the jobs report honest, nonpartisan civil servants is not to say that the jobs report is perfect. The report tries to estimate employment in a big country – and to do so quickly, to give policy makers, business executives and everyone else a sense of how the economy is performing. It’s a tough task.
And it has become tougher, because Americans are less willing to respond to surveys than they used to be.
A new academic paper suggests that the unemployment rate appears to have become less accurate over the last two decades, in part because of this rise in nonresponse. In particular, there seems to have been an increase in the number of people who once would have qualified as officially unemployed and today are considered out of the labor force, neither working nor looking for work.
[font color="red"]New material, added January 2016:[/font] From July 2013:
Mort Zuckerman: A Jobless Recovery Is a Phony Recovery
Mort Zuckerman: A Jobless Recovery Is a Phony Recovery
More people have left the workforce than got a new job during the recovery—by a factor of nearly three.
By Mortimer Zuckerman
July 15, 2013 7:09 p.m. ET
In recent months, Americans have heard reports out of Washington and in the media that the economy is looking up—that recovery from the Great Recession is gathering steam. If only it were true. The longest and worst recession since the end of World War II has been marked by the weakest recovery from any U.S. recession in that same period.
The jobless nature of the recovery is particularly unsettling. In June, the government's Household Survey reported that since the start of the year, the number of people with jobs increased by 753,000—but there are jobs and then there are "jobs." No fewer than 557,000 of these positions were only part-time. The survey also reported that in June full-time jobs declined by 240,000, while part-time jobs soared by 360,000 and have now reached an all-time high of 28,059,000—three million more part-time positions than when the recession began at the end of 2007.
That's just for starters. The survey includes part-time workers who want full-time work but can't get it, as well as those who want to work but have stopped looking. That puts the real unemployment rate for June at 14.3%, up from 13.8% in May.
The 7.6% unemployment figure so common in headlines these days is utterly misleading. An estimated 22 million Americans are unemployed or underemployed; they are virtually invisible and mostly excluded from unemployment calculations that garner headlines.
....
Mr. Zuckerman is chairman and editor in chief of U.S. News & World Report.
[center]On the Road Again[/center]
The DOL Newsletter - October 6, 2011
Have an iPhone, iPod Touch or Android phone? Now you can access the latest labor data and news from the department's Bureau of Labor Statistics and Employment and Training Administration in the palm of your hand. The latest free mobile app displays real-time updates to the unemployment rate, Unemployment Insurance initial claims, the Consumer Price Index, payroll employment, average hourly earnings, the Producer Price Index, the Employment Cost Index, productivity, the U.S. Import Price Index and the U.S. Export Price Index in real time, as they are published each week, month or quarter. News releases providing context for the data can also be accessed through the app and viewed within a mobile browser or as PDF documents.
US Labor Department launches economic and employment statistics app
WASHINGTON — The most up-to-date employment data and economic news releases from the U.S. Department of Labor's Bureau of Labor Statistics and its Employment and Training Administration now can be viewed using a new mobile application.
....
The new app is currently available for the iPhone and iPod Touch as well as Android phones. The Labor Department is working to develop versions for BlackBerry and iPad devices. Visit https://m.dol.gov/apps/ to download this and other mobile apps.
Download the Data, Other Mobile Apps
[center]A Few More Things[/center]
[font color="red"]New material, added February 4, 2016:[/font] This article appeared as "Stocks vs. the Economy: Which Ruins Which?"on page C2 of the print edition of The Wall Street Journal. on Tuesday, February 2, 2016.
2:49 pm ET
Feb 1, 2016
Markets
By John Carney
Don’t confuse the market for the economy. Markets have overshot fundamentals. There are no signs of contagion into the real economy. ... Anyone paying attention has heard some version of these sentiments lately. Paul Samuelson’s famous quip that the market has predicted nine of the past five recessions is once again on the lips of the wise men and women of Wall Street.
But what if the stock market is more than just an indicator? What if a stock selloff can actually cause unemployment and recessions? ... That’s exactly what historical data on the stock market and the unemployment rate running back to 1929 seem to suggest. A persistent 10% decline in the stock market pushes unemployment up three percentage points.
That, at least, is the finding of University of California Los Angeles economist Roger Farmer. Currently a Distinguished Professor of Economics at UCLA and a Visiting Scholar at the Federal Reserve Bank of San Francisco, Mr. Farmer has been a fellow at the Bank of England and has won awards for his work on inefficiency in financial markets and self-fullfilling prophecies.
In a pair of academic papers written in the wake of the financial crisis, the first published in 2012 and the second published this year, Mr. Farmer has argued that changes in the value of the stock market cause changes in the unemployment rate. The idea will be expanded upon in Mr. Farmer’s forthcoming book, Prosperity for All.
[font color="red"]Moved here, February 6, 2016:[/font] The Federal Reserve looks at, among many other things, the BLS employment reports when it decides what to do with "the interest rate." The interest rate in question is the federal funds target rate. Here is some information about that:
Federal funds rate
Meet FRED, every wonk’s secret weapon
By Todd C. Frankel August 1, 2014
FRED stands for Federal Reserve Economic Data. It serves as an online clearinghouse for a wealth of numbers: unemployment rates, prices of goods, GDP and CPI, things common and obscure. Today, FRED is more than a little bit famous, thanks to the public’s fascination with economic data.
Federal Reserve Economic Data
So how many jobs must be created every month to have an effect on the unemployment rate? There's an app for that:
Federal Reserve Bank of Atlanta Jobs Calculator™
(Note new link for Jobs Calculator™. Hat tip, progree.)
Monthly Employment Reports from BLS
The U.S. Department of Commerce releases economic data too. Some of its releases come from the U.S. Census Bureau:
U.S. Census Bureau Latest News
U.S. Census Bureau Economic Indicators
Other Department of Commerce releases come from the Bureau of Economic Analysis:
Bureau of Economic Analysis
For people who need a daily fix:
BLS-Labor Statistics Twitter feed
Read tomorrow's news before it happens. Here's the schedule for all economic reports:
MarketWatch Economic Calendar
and for BLS reports only:
Bureau of Labor Statistics Release Calendar

Steerpike
(2,692 posts)But there are a lot of underlying issues that are left out...Many people are working two part time jobs for less money than they may have earned before. Lots of older people who lost everything in 2008 have never recovered and work long hours for little money. Always with the knowledge that they will have to work till they die. The numbers on suicide for older people are up too...
TheFrenchRazor
(2,116 posts)IronLionZion
(45,433 posts)"seasonally adjusting" the numbers to favor Obama instead of the labor participation rate...oh wait!
Trump is such a job creator 
Bengus81
(6,931 posts)And as I said Donnie ALWAYS stated those unemployment numbers in the 4 range were BULLSHIT when Obama was in office. So I guess they are still BULL SHIT eh Cheeto??
progree
(10,904 posts)Last edited Fri Jan 5, 2018, 01:32 PM - Edit history (2)
(citing the Not In Labor Force number) and said the real unemployment rate is 40% --
Not in Labor Force, Age 16+ https://data.bls.gov/timeseries/LNS15000000
Here is the 11 months (through November) of 2017 (in thousands):
2017 94,366 94,190 94,213 94,375 94,983 94,813 94,657 94,785 94,417 95,385 95,420
Interestingly, its up by 1,054,000 since the inaugural month of January, so you don't hear very much about it from Trump or his Trumpanzees anymore.
I discuss this some more at
https://www.democraticunderground.com/?com=view_post&forum=1017&pid=466755
Here is the official unemployment rate: https://data.bls.gov/timeseries/LNS14000000
And the rates each month of 2016 and 2017:
2016: 4.9 4.9 5.0 5.0 4.7 4.9 4.9 4.9 4.9 4.8 4.6 4.7
2017: 4.8 4.7 4.5 4.4 4.3 4.4 4.3 4.4 4.2 4.1 4.1
(you remember well -- 4.6% and 4.7% in the last two full months of the Obama administration)
Some other stats of interest:
Civilian labor force, 16 and over, thousands, https://data.bls.gov/timeseries/LNS11000000
Civilian noninstitutional population, 16 and over, Thousands, https://data.bls.gov/timeseries/LNS10000000
Since January, the Labor Force has grown by only 813,000,
the Not in Labor Force number has grown by 1,054,000
while the civilian non-institutional population (the sum of the above two numbers) has grown by 1,867,000

LenaBaby61
(6,974 posts)That workers wages are STAGNANT, and aren't keeping up with inflation.
progree
(10,904 posts)Inflation Adjusted Weekly Earnings of Production and Non-Supervisory Workers https://data.bls.gov/timeseries/CES0500000031
Through October 2017 (there isn't inflation (CPI) data for November yet)

I edited it to begin at 1969 -- the beginning of a presidential term (Nixon's first term). And it hash marks every 4 years, so they all coincide with the beginning of presidential terms (January 1969 - Nixon I, January 1973 - Nixon II/Ford, January 1977 - Carter, January 1981 - Reagan I, January 1985 - Reagan II, January 1989 - Bush Sr., January 1993 - Clinton I, January 1997 - Clinton II, January 2001-G.W. Bush I, January 2005 - G.W. Bush II, January 2009 - Obama I, January 2013 - Obama II, January 2017 - Caligula
TheFrenchRazor
(2,116 posts)an ok looking number, but that doesn't help all the people who can not find good paying jobs. also, i think the CPI inflation numbers aren't very meaningful either; they leave out some important things.
progree
(10,904 posts)Last edited Sun Dec 10, 2017, 12:13 PM - Edit history (1)
production and non-supervisory workers (a) don't own a business (b) work for an employer for salary/wages (c) don't have any staff or supervise anyone. Roughly the bottom 80% of the workforce.
I prefer median statistics too, but that is problematical too in that it completely leaves out those over the 50 percentile -- 50% of the entire population.
mahatmakanejeeves
(57,425 posts)You can link to the tables from the website linked in the OP.
In November, average hourly earnings for all employees on private nonfarm payrolls rose by 5 cents to $26.55. Over the year, average hourly earnings have risen by 64 cents, or 2.5 percent. Average hourly earnings of private-sector production and nonsupervisory employees rose by 5 cents to $22.24 in November. (See tables B-3 and B-8.)
mahatmakanejeeves
(57,425 posts)* * * * *
[center]Facilities for Sensory Impaired[/center]
Information from this release will be made available to sensory impaired individuals upon request. Voice phone: 202-691-5200, Federal Relay Services: 1-800-877-8339.
* * * * *
If you're strapped for time, the quick read is here: Commissioner's Statement on The Employment Situation
https://www.bls.gov/news.release/jec.nr0.htm
Statement of
William J. Wiatrowski
Acting Commissioner
Bureau of Labor Statistics
Friday, December 8, 2017
* * * * *
It used to be that you could get free access to articles in The Wall Street Journal. by going in through TWSJ.'s Twitter account or the Twitter accounts of the authors:
How to get around the paywall to read articles in The Wall Street Journal.:
This trick doesn't seem to work anymore, but you might be able to get in if they've slipped up. Here are those accounts:
* * * * *
The Wall Street Journal.: @WSJ
https://twitter.com/wsj
Wall Street Journal
Breaking news and features from the WSJ.
* * * * *
Ben Leubsdorf: @BenLeubsdorf
https://twitter.com/BenLeubsdorf
I cover the economy at @WSJ. @ConMonitorNews, @AP, @the_herald alum. DC native. Hyperactive news omnivore. Also I like burritos. ben.leubsdorf@wsj.com
* * * * *
Josh Zumbrun: ?@JoshZumbrun
https://twitter.com/JoshZumbrun
National economics correspondent for the Wall Street Journal. Covering the world's usual state of greed and disorder, confusion and apathy. josh.zumbrun@wsj.com
* * * * *
Nick Timiraos: @NickTimiraos
https://twitter.com/NickTimiraos
National economics correspondent, The Wall Street Journal
Please look at the tweets, as Nick Timiraos likes to slice and dice the data every which way.
* * * * *
Jeffrey Sparshott: @jeffsparshott
https://twitter.com/jeffsparshott
Jeffrey.Sparshott@wsj.com
* * * * *
Paul Vigna: @paulvigna
https://twitter.com/paulvigna
Markets, bitcoin, and the zombie apocalypse.
* * * * *
Eric Morath: @EricMorath
https://twitter.com/EricMorath
Eric.Morath@wsj.com
I'm a Wall Street Journal economy reporter, dad, husband and Spartan for life. eric.morath@wsj.com
Washington DC
blogs.wsj.com/economics/
* * * * *
Sarah Chaney: @sechaney
https://twitter.com/sechaney
Economy Reporter at The Wall Street Journal. Tar Heel. sarah.chaney@wsj.com
* * * * *

mahatmakanejeeves
(57,425 posts)See our interactive graphics on today’s #JobsReport http://go.usa.gov/cn5B4 #BLSdata #DataViz
Link to tweet
* * * * *
More charts and analysis on the November nonfarm payroll employment numbers http://go.usa.gov/4UqY #JobsReport #BLSdata
Link to tweet
* * * * *
Understanding BLS Unemployment Statistics #JobsReport #BLSdata
Link to tweet
* * * * *
By Josh Zumbrun
Dec 8, 2017 10:10 am ET
Employers added 228,000 workers in November, and the unemployment rate held at a 17-year low, signs the economy is on its firmest footing in at least a decade.
....
{subscription required}
* * * * *
8:56 am EST Dec 8, 2017
By Sarah Chaney
https://twitter.com/sechaney
sarah.chaney@wsj.com
{I don't recall having seen that name before}
U.S. employers added 228,000 jobs in November, and the unemployment rate was unchanged from a month earlier at 4.1%. Economists surveyed by The Wall Street Journal had expected 195,000 new jobs and a 4.1% jobless rate. Here are some of the key figures from Friday’s Labor Department report.
{snip, but no subscription required}
mahatmakanejeeves
(57,425 posts)to all the people who have read the thread.
I would especially like to thank those who have written a reply. I learn something every month, and yet I feel that I am always catching up.
Finally, I would like to thank the BLS for its continued impartiality. They'll be getting a new commissioner soon, and we'll have to see what happens next. I hope that he sits down with the existing staff and is respectfully reminded that much is expected of him.
There are plenty of places online where you can read the BLS reports, but no is shilling five-gallon buckets of prepper chow or precious metals at this one at DU. I'm sure you know what I mean.
This is the one thread per month that I absolutely, positively have to make. I enjoy doing it more than you can imagine.
Happy holidays, or whatever it is you are celebrating.
TheFrenchRazor
(2,116 posts)the reality is that there are not nearly enough good paying jobs for the number of people who need them.
progree
(10,904 posts)Last edited Sun Dec 10, 2017, 07:16 PM - Edit history (4)
You would have to go back to the 1970s and before to find better inflation-adjusted numbers -- and that was mostly for white males. It was not a great economy for single women or people of color.
Also, see #35 for the average wage of production and non-supervisory workers.
If you have some statistics from reputable sources (not Zerohedge etc.) that back up what you are saying -- whatever it is -- please provide.
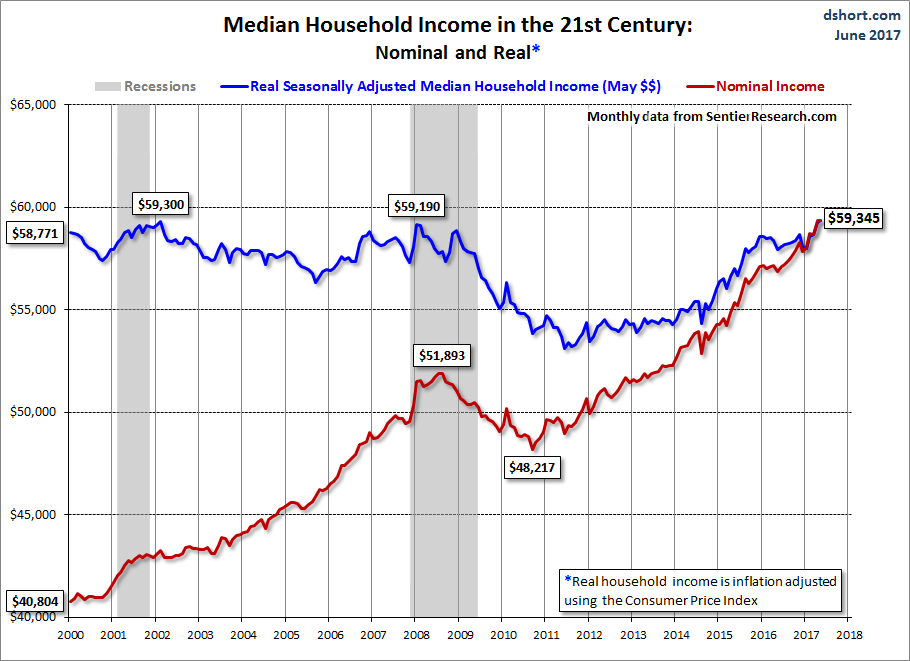
Here's median household income (since you don't like averages). Although that statistic is problematic too considering that household sizes have been shrinking and there are more over-65 retired people than there were in 2000. Yes, median household income has been stagnant on an inflation-adjusted basis. And unfortunately the farthest it goes back is 2000. And as always, median statistics entirely leaves out half of the population -- the population over the 50 percentile.
http://advisorperspectives.com/dshort/updates/Median-Household-Income-Update.php
https://www.advisorperspectives.com/dshort/updates/2017/06/22/may-real-median-household-income-little-changed-from-april-last-report
On Edit - here is a link to the Census Bureau's median real household income (i.e. inflation-adjusted)
It begins in 1984 and goes through 2016 (its an annual thing)
https://fred.stlouisfed.org/series/MEHOINUSA672N
1984: $49,355, 1999 (peak year until 2016): 58,655, 2012: (local bottom): 53,331, 2016: 59,039
Though 1984 wasn't a great year -- it was shortly after the 1980-1983 double-dip recession. So the above is starting from a low base year.
As the graph clearly demonstrates
 ?g=gyBg
Ha ha. I wish I knew how to embed a FRED graph in DU, sigh (I'm seeing a wonderful FRED border surrounding an entirely empty white area).
