Environment & Energy
Related: About this forum3 Major Nor'easters in 11 Days, But No, No, Climate Breakdown Has Nothing To Do With It
A major nor’easter is pummeling states from New York through Maine today with heavy snow, near hurricane force winds, and high surf. The storm is expected to dump 1-2 feet of snow over this region even as it pounds coastlines that have already been raked by two other major storms during the past two weeks.
It would be relatively unusual to see one storm of such intensity striking this region during any given March. But as the third in a two-week-long parade of extreme events, the presently intense storm pattern is starting to look more than a little outlandish. So what the heck is going on? In a couple handfuls of words — influences related to human-caused climate change are spiking East Coast storm intensity while setting in place a general pattern that causes these storms to repeatedly fire.
 ?w=626&h=311
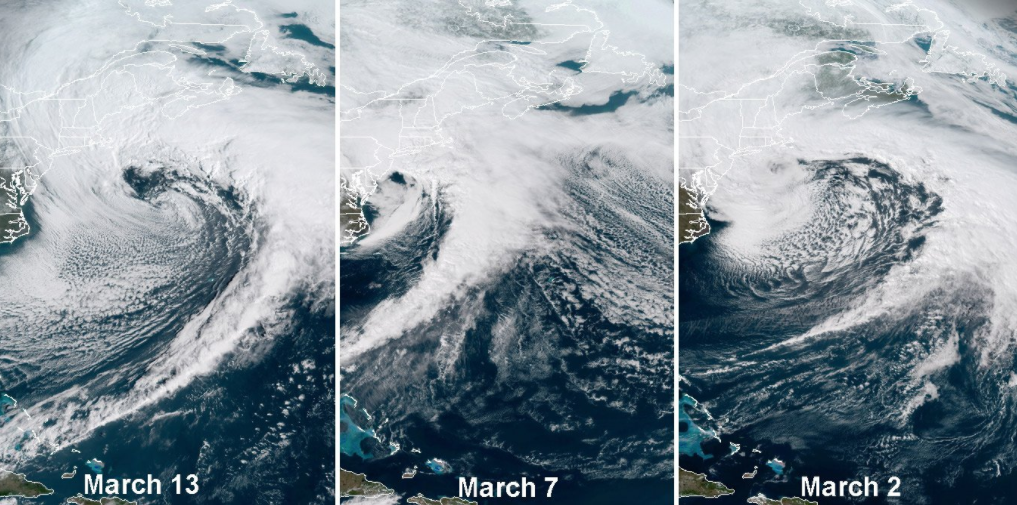
(Over the past 11 days, three major nor’easters have struck the U.S. East Coast. Why have these storms been both so strong and such a persistent feature? Image source: RAMMB/CIRA. H/T to Chris Dolce.)
Presently, the most recent strong storm has an intensity of 970 mb and features winds gusting to hurricane force just off-shore with gusts of up to 69 mph along the coast. Pressures are expected to drop into the upper 960s — making it about as powerful as the system that produced major flooding in parts of New England on March 2nd.
For reference, storm intensity measured by pressure in the range of 970 mb is about as strong as a category 2 hurricane. This is a rough comparison as hurricanes tend to be more intensely concentrated even as nor’easters tend to have broader if more diffuse impacts. But it’s a marker for the high level of atmospheric energy the system is now pumping out and how potentially damaging it could ultimately become. The storm is thus strong enough to produce record and historic impacts. This is notable enough by itself. But the fact that we have had three systems of similar strength in just 11 days over what is practically the same region is concerning.
EDIT
Looking for causes, we need to go all the way back to February. At that time, a big polar warming event was taking place. In the upper levels of the atmosphere over the pole, the stratosphere was warming up. But at the same time, surface temperatures at the pole were rising to above freezing. In some locations near Northern Greenland, readings were pushing as high as 63 F above average.
High amplitude Jet Stream waves were eating away at the typically faster polar circulation patterns even as they were helping to inject much warmer than normal air into the Arctic and pull its resident cold air out. Eventually, all this heat running into the various layers of the Arctic atmosphere drove the polar vortex to collapse. This, in turn, resulted in cold Arctic air being ejected south and west into Europe. This massive jet stream dip, in eddy-like fashion produced a large, countervailing high pressure ridge over Greenland.
 ?w=600
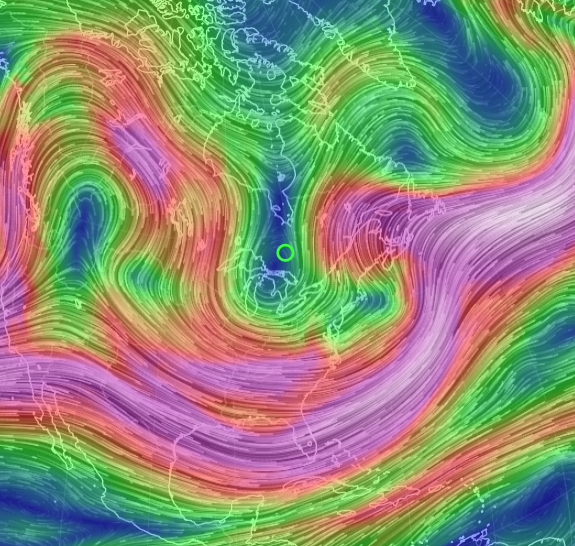
(A deep trough that has consistently lingered over the U.S. East Coast and helped to spawn storm after powerful storm, was initially generated by a very intense polar warming event linked to human-caused climate change. Image source: Earth Nullschool.)
EDIT
https://robertscribbler.com/2018/03/13/why-are-so-many-powerful-noreasters-striking-new-england/#comment-138986
 = new reply since forum marked as read
Highlight:
NoneDon't highlight anything
5 newestHighlight 5 most recent replies
= new reply since forum marked as read
Highlight:
NoneDon't highlight anything
5 newestHighlight 5 most recent replies

dhol82
(9,353 posts)Still early but the signs are there.

Rhiannon12866
(205,320 posts)
NNadir
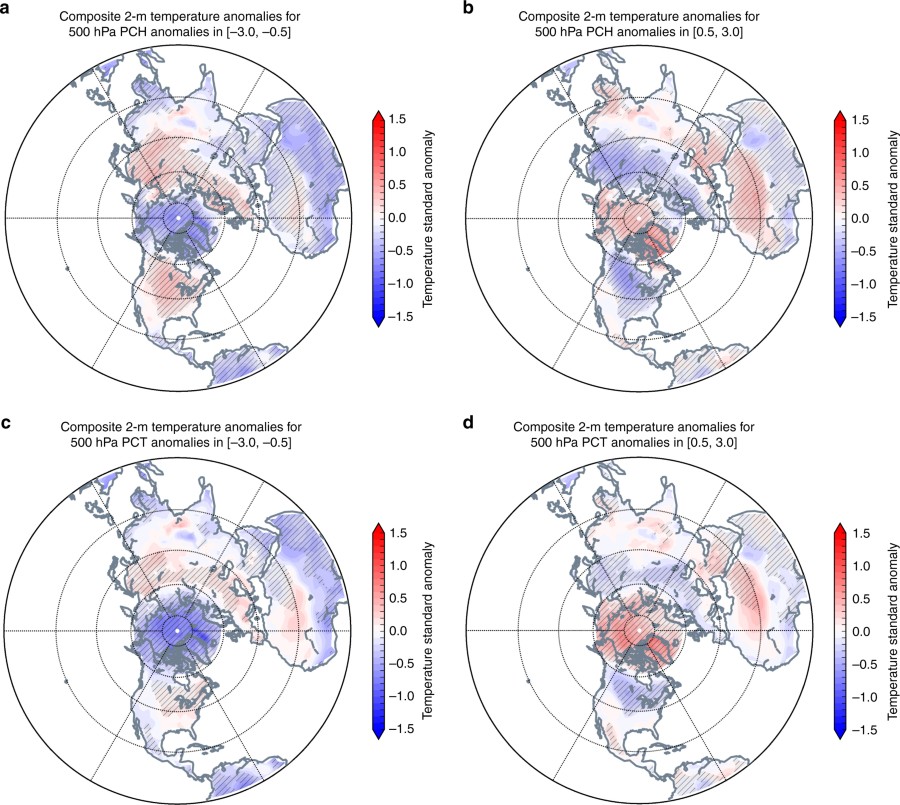
(33,516 posts)Increasing greenhouse gases are contributing to a general warming of the atmosphere and oceans globally10. Over recent decades, warming has dominated global temperature trends during three of the seasons11. In winter, however, cooling trends have been observed across Eurasia and the eastern US12,13,14 along with rapid warming in the Arctic5,6,15. This seesaw winter temperature pattern is known as the “warm-Arctic/cold-continents pattern”16. A vigorous debate in the climate community is whether and/or how much the Arctic can influence mid-latitude weather9,17 and, in particular, whether a warmer Arctic increases the likelihood of severe cold spells in the mid-latitude continents18...
It is, again, open sourced, and can be read with a click in its entirety.