Environment & Energy
Related: About this forumNSIDC/NOAA - Arctic Sea Ice Extent In May 2nd-Lowest In 40-Year Instrumental Record
May saw above average temperatures over nearly all of the Arctic Ocean, Baffin Bay, and Greenland. Early sea ice retreat in the Bering Sea extended into the southern Chukchi Sea. Northern Baffin Bay and the Nares Strait have low ice cover. By month’s end, open water extended along the northeastern Alaskan and northwestern Canadian coasts, all well ahead of schedule. However, this was partly balanced by slower-than-average ice loss in the Barents Sea. At the end of May, Arctic sea ice daily extent stood at second lowest in the 40-year satellite record.

Figure 1. Arctic sea ice extent for May 2019 was 12.16 million square kilometers (4.70 million square miles). The magenta line shows the 1981 to 2010 average extent for that month. Sea Ice Index data. About the data
Arctic sea ice extent averaged for May was 12.16 million square kilometers (4.70 million square miles). This is 1.13 million square kilometers (436,000 square miles) below the 1981 to 2010 average and 240,000 square kilometers (93,000 square miles) above the previous record low for the month set in May 2016. The month saw rapid ice loss in the Bering Sea and southern Chukchi Sea. During the second half of the month, an extended coastal polynya opened along the northwestern coast of the Beaufort Sea extending into the Mackenzie River Delta area. Visible MODIS imagery shows many large ice floes interspersed with open water along the ice edge and fracturing of ice further within the pack.
Although ice loss in the Barents Sea was rapid in early May, it subsequently slowed and extent slightly increased late in the month. There was nevertheless an overall ice retreat for May as a whole. Around mid-month, a polynya began to open at the north end of Baffin Bay, near the Nares Strait. At about this time, an ice arch that restrains southward ice drift in the Lincoln Sea began to fail, allowing transport of ice through the strait and creating a small polynya northwest of Greenland (discussed below). By the end of May, other polynyas started to form around the New Siberian Islands as well as Severnaya Zemlya, and open water began to develop along coastal regions in the Kara Sea and in northern Hudson Bay.
Conditions in context

Figure 2a. The graph above shows Arctic sea ice extent as of June 3, 2019, along with daily ice extent data for four previous years and the record low year. 2019 is shown in blue, 2018 in green, 2017 in orange, 2016 in brown, 2015 in purple, and 2012 in dotted brown. The 1981 to 2010 median is in dark gray. The gray areas around the median line show the interquartile and interdecile ranges of the data. Sea Ice Index data.
Broadly following the pattern for April, air temperatures at the 925 hPa level (approximately 2,500 feet above the surface) for May were again well above average over nearly all of the Arctic Ocean. Along the western Greenland coast, a broad area north of Greenland, and westward north of the Canadian Archipelago, temperatures were as much as 7 degrees Celsius (13 degrees Fahrenheit) above the 1981 to 2010 reference average for the month. Over much of the remainder of the Arctic Ocean, temperatures were 2 to 4 degrees Celsius (4 to 7 degrees Fahrenheit) above average. By contrast, over the Barents Sea as well as along the Laptev Sea coast, temperatures were near average or up to 2 degrees (4 degrees Fahrenheit) below average. As averaged for May, there was an area of high sea level pressure, an anticyclone, centered near the pole. This pattern drew warm air from the south into Baffin Bay and into the Arctic Ocean. Also, air under an anticyclone descends and warms. Both factors help to explain the unusually high temperatures over much of the Arctic Ocean.
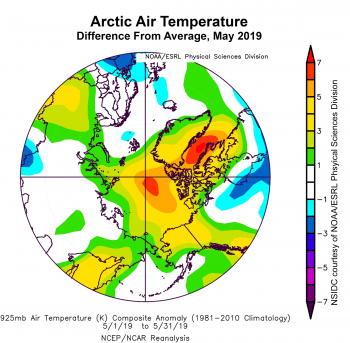
Figure 2b. This plot shows the departure from average air temperature in the Arctic at the 925 hPa level, in degrees Celsius, for May 2019. Yellows and reds indicate higher than average temperatures; blues and purples indicate lower than average temperatures.
May 2019 compared to previous years
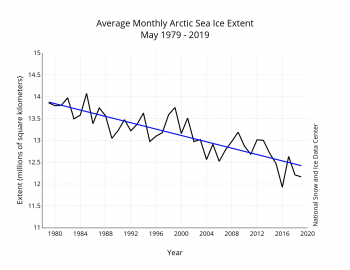
Figure 3. Monthly May ice extent for 1979 to 2019 shows a decline of 2.74 percent per decade.
Overall, sea ice extent during May 2019 decreased by 1.49 million square kilometers (575,300 square miles). This was fairly close to the 1981 to 2010 average loss for the month. The linear rate of sea ice decline for May from 1979 to 2019 is 36,400 square kilometers (14,100 square miles) per year, or 2.74 percent per decade relative to the 1981 to 2010 average.
EDIT
https://nsidc.org/arcticseaicenews/