Environment & Energy
Related: About this forumNSIDC 7/5/12 - Sea Ice Tracking At Record Lows - Past 3 Junes Lowest Ice Extent In Satellite Records
Arctic sea ice extent declined quickly in June, setting record daily lows for a brief period in the middle of the month. Strong ice loss in the Kara, Bering, and Beaufort seas, and Hudson and Baffin bays, led the overall retreat. Northern Hemisphere snow extent was unusually low in May and June, continuing a pattern of rapid spring snow melt seen in the past six years.
Overview of conditions
Arctic sea ice extent for June 2012 averaged 10.97 million square kilometers (4.24 million square miles). This was 1.18 million square kilometers (456,000 square miles) below the 1979 to 2000 average extent. The last three Junes (2010-2012) are the three lowest in the satellite record. June 2012 ice extent was 140,000 square kilometers (54,000 square miles) above the 2010 record low. Ice losses were notable in the Kara Sea, and in the Beaufort Sea, where a large polynya has formed. Retreat of ice in the Hudson and Baffin bays also contributed to the low June 2012 extent. The only area of the Arctic where sea ice extent is currently above average is along the eastern Greenland coast.
The ice extent recorded for 30 June 2012 of 9.59 million square kilometers (3.70 million square miles) would not normally be expected until July 21, based on 1979-2000 averages. This puts extent decline three weeks ahead of schedule.
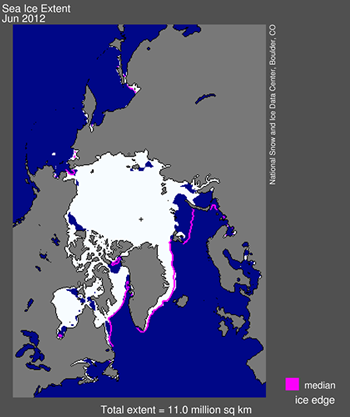
Figure 1. Arctic sea ice extent for June 2012 was 10.97 million square kilometers (4.24 million square miles). The magenta line shows the 1979 to 2000 median extent for that month. The black cross indicates the geographic North Pole. Sea Ice Index data.
Conditions in context
In June, the Arctic lost a total of 2.86 million square kilometers (1.10 million square miles) of ice. This is the largest June ice loss in the satellite record. Similar to May, the month was characterized by a period of especially rapid ice loss (discussed in the mid-month entry, June 19th) followed by a period of slower loss. Warm conditions prevailed over most of the Arctic; temperatures at the 925 hPa level (about 3000 feet above the ocean surface) were typically 1 to 4 degrees Celsius (1.8 to 7.2 degrees Fahrenheit) above the 1981 to 2010 average, and as much as 7 to 9 degrees Celsius (12.6 to 16.2 degrees Fahrenheit) above average over northern Eurasia and near southern Baffin Bay. Weather patterns over the Arctic Ocean varied substantially through the month.

Figure 2. The graph above shows Arctic sea ice extent as of June 18, 2012, along with daily ice extent data for the previous four years. 2012 is shown in blue, 2011 in orange, 2010 in pink, 2009 in navy, 2008 in purple, and 2007 in green. The gray area around the average line shows the two standard deviation range of the data.
Sea level pressure favors the advection of ice
A pattern of high pressure over the Beaufort Sea and low pressure over the Laptev Sea has been present for the past few weeks. This pattern is favorable for summer ice loss, by advecting warm winds from the south (in eastern Asia) to melt the ice and transport it away from the coastlines in Siberia and Alaska. The high pressure over the Beaufort leads to generally clear skies, and temperatures are now above freezing over much of the Arctic pack. Snow cover in the far north is nearly gone, earlier than normal, allowing the coastal land to warm faster.
Early melt onset, and clear skies near the solstice are favorable conditions for more rapid melting, and warming of the ocean in open-water areas. The persistence of this type of pressure pattern throughout summer 2007 was a major factor toward causing the record low September extent that year. Conversely, in 2010, the patterns were not as favorable for loss of ice and the seasonal decline slowed later in the summer, and the extent did not approach the record low levels of 2007.
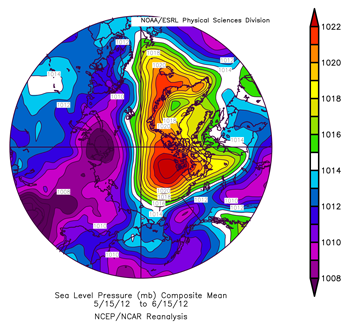
Figure 3: This map of mean sea level pressure from 15 May 2012 to 15 June 2012 shows a pattern of high pressure over the Beaufort Sea and a pattern of low pressure over the Laptev Sea, conditions favorable to summer ice loss.
While these patterns and conditions have looked similar to 2007, over the last couple days the high pressure pattern over the Beaufort Sea has broken down. And while the extent is at a record low for the date, it is still early in the melt season. Changing weather patterns throughout the summer will affect the exact trajectory of the sea ice extent through the rest of the melt season.
EDIT/END
On edit - sorry forgot link!
http://nsidc.org/arcticseaicenews/2012/06/sea-ice-tracking-at-record-low-levels/