Environment & Energy
Related: About this forumA simple graph: The primary energy mix
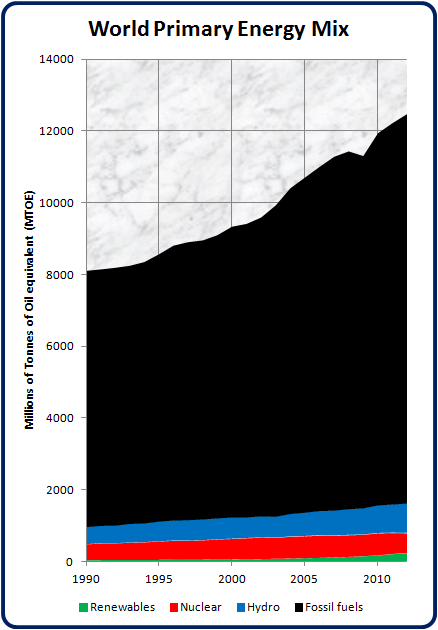
The spreading blackness is what is killing us.
The green sliver is supposed to save us.
I wonder what this graph will look like in another 20 years?
 = new reply since forum marked as read
Highlight:
NoneDon't highlight anything
5 newestHighlight 5 most recent replies
= new reply since forum marked as read
Highlight:
NoneDon't highlight anything
5 newestHighlight 5 most recent replies

dimbear
(6,271 posts)That's the planet's main hope.
GliderGuider
(21,088 posts)What if the rising green sliver just lifts the blackness up instead of replacing it?
dimbear
(6,271 posts)GliderGuider
(21,088 posts)OK, maybe one more generation.
WASHINGTON (AP) — Starting in about a decade, Kingston, Jamaica, will probably be off-the-charts hot — permanently. Other places will soon follow. Singapore in 2028. Mexico City in 2031. Cairo in 2036. Phoenix and Honolulu in 2043.
And eventually the whole world in 2047.
A new study on global warming pinpoints the probable dates for when cities and ecosystems around the world will regularly experience hotter environments the likes of which they have never seen before.
And for dozens of cities, mostly in the tropics, those dates are a generation or less away.

CRH
(1,553 posts)
joshcryer
(62,280 posts)When would it magically explode?
GliderGuider
(21,088 posts)It pisses kristopher off too much.
Because I insist on fitting a curve to the black part as well.
joshcryer
(62,280 posts)It's obviously moving upward. Assume the best case scenario.
The black is a finite resource. The green isn't (edit 2: for all practical purposes).
I suck at graphing. Perhaps send me your excel file or resources?
edit: to clarify further, we've likely hit peak fossil fuel, as far as how much we can effectively extract vs how much we can burn, if not now, soon. So its finiteness is unquestionable.
GliderGuider
(21,088 posts)
The best-case fit in Excel is a 3rd order polynomial.
On this plot the slope of the renewable trend matches the current rate of increase in total primary energy between 2040 and 2050.
On edit: starting the plot in 1995 gives a slightly more optimistic result:
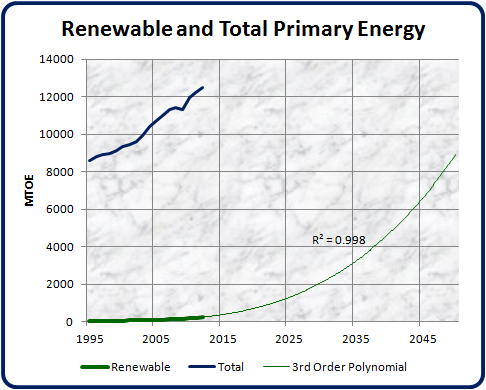
On this plot the slopes match around 2035.

kristopher
(29,798 posts)The difference between primary energy and final energy consumption?

Or this

Or this?

Or this?
Or the mass introduction of electric drive vehicles for personal transportation, estimated to be 7% of global market by 2020?
Predictions are for 300GW of solar by 2020, so what about this?

The type of simplistic modeling you are doing is meaningless.
GliderGuider
(21,088 posts)Against my better judgement, too.
kristopher
(29,798 posts)joshcryer
(62,280 posts)
joshcryer
(62,280 posts)Didn't see this post until today.
Of course, by 2050 MTOE will have gone up significantly.
GliderGuider
(21,088 posts)
caraher
(6,279 posts)If you have a percent annual growth rate, the doubling time (in years) is 70/rate. So for instance, if your growth rate is 5% per year, the doubling time is 35 years. That's an approximation based on the same math as exponential growth. (70 is close to 100 times the natural log of 2...)
This way you can decide how many doublings constitutes your magical explosion and multiply by the doubling time to get your answer...
kristopher
(29,798 posts)It is therefore energy we do not need to replace if the production is from a non-thermal source of generation. You'll notice that this look based on end user consumption is a distinctly different view of the matter.
From IRENA's REN21, 2012
Now note the decoupling of CO2 emissions from GDP in the US and EU.

And the movement by China


I don't know what policies the world will effect in the next 25 years, but there is no basis for saying our future course can be explicated by simply looking at the graphs you are drawing.
GliderGuider
(21,088 posts)Carbon emissions are the issue. Absolute numbers are what count, because the atmosphere has a finite mass.
kristopher
(29,798 posts)It has a direct bearing on your remark in post 2, for example:
"What if the rising green sliver just lifts the blackness up instead of replacing it?"
You've basically postulated a false model based on a perceived direct link between historic growth in GDP and growth in emissions. As the graphs in my post show, that linkage most definitely isn't accurately represented by lumping it into a global average.
The significance can be confirmed easily by asking where the world would be were we still emitting at 1990 rates of emissions and today's GDP.
As to your remark about what pisses me off, you couldn't be further off unless you tried to draw it with one of your graphs. What I consider unacceptable is falsifying conclusions with deceptive data - and you are a legend when it comes to that.
GliderGuider
(21,088 posts)If that happens we will keep being able to raise GDP despite declining fossil supplies and rising prices. and that means we'll be able to afford to keep using fossil fuels. And that means that carbon emissions will keep getting higher for probably the next 50 years.
We need to get carbon emissions headed down NOW. That's not happening, so we're cooked.
kristopher
(29,798 posts)In the face of the available evidence, it is possibly the least intelligent thing you've ever written.
GliderGuider
(21,088 posts)so you got to please yourself.

muriel_volestrangler
(101,402 posts)Look at world CO2 emissions since 1990, and the EIA's projections up to 2040: http://www.eia.gov/forecasts/ieo/emissions.cfm
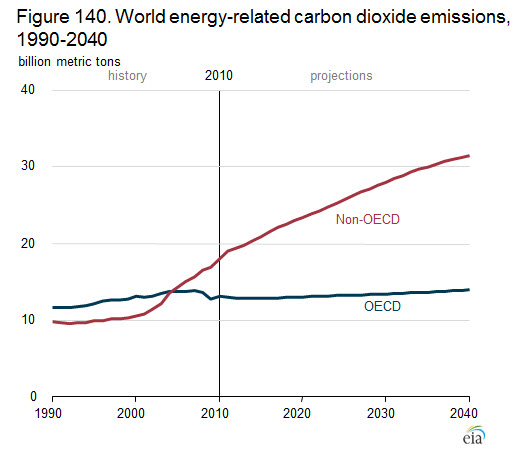
They show they have been increasing, and they expect them to continue increasing throughout the period. That 'warped thinking' has the evidence of the recent past on its side. It just expects human behaviour to not change.
kristopher
(29,798 posts)
Head-in-the-sand in this case meaning that when one ignores all other relevant inputs to the calculus the output is destined to be garbage.
The fact of the matter is that conservative forecasts about the progress of alternative energy sources have consistently been, not only wrong, but grossly wrong. Reviewing the issue shows that high renewable growth scenarios have consistently proven to be far more accurate than conservative growth scenarios. (Under 'Fair Use' I've included the excerpt from the free downloadable International Renewable Energy Association's (IRENA) 2013 Global Futures Report. This 76 page non-technical report is
"a pioneering publication that provides access to the range of credible possibilities on the future of renewable energy. The report is based on interviews with over 170 leading experts around the world and the projections of 50 recently published scenarios. The report can serve as a tool for dialogue and discussion on future options, and compliments well the REN21 Renewables Global Status Report.
Available here:
http://www.ren21.net/REN21Activities/GlobalFuturesReport.aspx
So, in terms of historic credibility, the Greenpeace estimate has far more standing than the EIA.

In 2011, about 30 countries were getting 20% or more of their total energy from renewables, and some as high as 50%.c (The “total energy” metric counts electricity, heating/cooling, and transport.) Countries in this category include Austria, Brazil, Chile, Denmark, Finland, Iceland, New Zealand, Norway, Peru, the Philippines, Portugal, Romania, Sweden, Uganda, and Uruguay. The European Union (EU) as a whole and the United States both stood at 12%. France, Germany, Italy, Spain, and several other countries were above 10%, and Japan was at 6%. Furthermore, in 2011, about half of all new electric power capacity added worldwide was renewable—as much capacity as fossil and nuclear combined. In interviews, industry experts emphasized that historical thinking and projections about renewable energy remaining a “fringe” techno- logy no longer make sense.
During the late 1990s and early 2000s, as renewable energy started to grow more rapidly than many had predicted, new sce- narios emerged that showed much higher long-term shares of renewables. Notable among these was a “Sustained Growth” scenario by the Shell oil company that showed 50% of global energy from renewables by 2050, a figure that shocked many at the time. The IEA also released a report, Energy to 2050: Scenarios for a Sustainable Future, that outlined a “Sustainable Development” scenario with a 35% share from renewables.
By the mid-2000s, a larger number of scenarios emerged showing 30–50% shares. Prominent among these was the first (2006) edition of the IEA Energy Technology Perspectives (ETP), which gave a set of “Accelerated Technology” scenarios for 2050. In these sce- narios, an intermediate case showed a 24% share, and the highest case showed a 30% share. A few years earlier, the German Advisory Council on Global Change (2004) had published its “Exemplary Path” scenario that projected a 50% share by 2050. And in 2007, the first edition of the Energy [R]evolution scenario by Greenpeace and the European Renewable Energy Council (EREC) likewise projected a 50% share by 2050
The most recent scenarios, published in 2010–2012, could be viewed in three main groups: “conservative,” “moderate,” and “high renewables.”5 See Figure 1 for the wide variation between groups. (See Annex 2 for a list of the recent global, regional, and national scenarios covered in this report, including full citations correspond- ing to scenario abbreviations used throughout the text, and see the online supplement, “Scenario Profiles Report,” for summaries of these scenarios.)
Conservative scenarios in the 15–20% range can be found pub- lished by oil companies, some industry groups, the IEA, and the U.S. Energy Information Administration (EIA). For example, BP’s Energy Outlook 2030 (2012) and ExxonMobil’s Outlook for Energy: A View to 2040 (2012) both show an under-15% share by 2030–2040. The EIA (2011) shows 14% by 2035, and the IEA’s World Energy Outlook (WEO, 2012), in its “New Policies” scenario, shows 18% by 2035. Conservative viewpoints by oil and gas companies mirror such conservative scenarios. These companies continue to make state- ments such as “fossil fuels will continue to provide the majority of the world’s energy supplies for decades to come” (Chevron), and “oil’s preeminence in the global energy mix will remain unchallenged in the foreseeable future” (Total).
Moderate scenarios show long-term renewable energy shares in the 25–40% range. Two IEA examples are the IEA WEO (2012) “450” carbon-stabilization scenario, which shows a 27% renewable energy
16 share by 2035, and the IEA ETP (2012) “2DS” scenario, which shows a 41% share by 2050. The IPCC Special Report on Renewable Energy (2011) synthesized the results of over 160 climate-mitigation scenarios (most from 2009–2010) and found that over half of them project shares above 27% by 2050—a large group in the “moderate” category.7 (And many show very high absolute amounts of renewables, too, under high global energy demand scenarios; see Box 2.)
High-renewables scenarios project 50–95% energy shares of renewables by 2050. For example, the GEA Global Energy Assessment (2012) shows up to 75% in the highest of its “Efficiency” cases and a median share of 55%. The “ACES” scenario by the IEA multilateral program Renewable Energy Technology Deployment (2010) shows 55%. And among the group of 160 scenarios surveyed by the IPCC (2011), there are a number in the range of 50–80%. The biennial Greenpeace Energy [R]evolution scenario, which has become the most widely recognized and thorough projection made by renew- able energy advocates, shows 82%.a At the highest end, WWF (2011) shows a 95% share.8
The credibility of such high-renewables scenarios has increased over the years, following a long tradition of “100%” scenarios dating back to the 1970s by renewable energy advocates and visionaries. The difference is that now, given the scope of government policy targets and market growth in recent years, such high-renewables scenarios are grounded in growing present-day markets.9 (See Endnote 9 for further discussion of “credibility” in the context of scenarios.)
In interviews, most industry experts believed that the world could reach at least 30–50% shares of renewables in the long term. (See also Box 3 for a recent global goal of 30–35%.) And some experts advocated for 100% or near-100% futures. European experts cited considerably higher shares just for Europe (see following section), with many saying that Europe could attain 50–70% shares.10 (Also see following sections for more expert opinions based on individual sectors.)
joshcryer
(62,280 posts)But we can pretend that we're doing something about climate change if we want.
GliderGuider
(21,088 posts)The existence of sovereignty means that each country gets to make its own decisions about energy sources. If fossil fuel demand declines in one nation, that tends to drop prices globally. Dropping prices tend to drive up consumption, especially if the product can be exported to places with higher demand. Given the variety of conditions in countries around the globe, there are going to be export markets for fossil fuels - as China has demonstrated. Others will follow in China's footsteps if they see an international economic advantage in doing so. And a lot of people out there aspire to an OECD standard of living.
Your graphs have a distinctly first-world/OECD perspective, and ignore the pent-up demand from the other half of the world. As fossil fuel prices drop and supplies stay on the world market, what happens to the rest of Asia, to Africa and South America? think they'll sit on their hands if there's advantage to be gained? I don't. If they don't, it will take a lot longer than you hope for the local problems of carbon emissions to stop being a rising global problem.
It's not so much the data you have a problem with, it's the conclusions I (quite honestly and transparently) draw from it. My conclusions are diametrically opposed to yours. Yours are based on hope, mine are not.
kristopher
(29,798 posts)The fact is that in "the other half of the world" renewables are already superior to fossil fuels. Diesel is the preferred fossil choice in those countries because it is transportable at a small scale and runs in community generators. The lack of a grid solidifies the cost advantage that renewables already posses.
We didn't leave the stone age because we ran out of stones.
GliderGuider
(21,088 posts)kristopher
(29,798 posts)There aren't too many ways to explain someone driven as you are to incessant attempts to deceive people who have never done you wrong. And none of those possible explanations would be considered flattering unless one had a very skewed sense of self.

NickB79
(19,280 posts)Outsourcing.
The decoupling shown in your graph started LONG before renewables were booming anywhere globally. Why?
Because the US and EU moved from factory driven economies to service based ones. The factories were then built in China and India instead. Moving CO2 emissions from one nation to another didn't make them any less real.
When China's economy decouples from CO2 emissions, it will be in large part due to a similar transition. In which case, the world will find another impoverished nation to set up to supply us with cheap plastic and potmetal crap (most likely Africa and Southeast Asia).
kristopher
(29,798 posts)...and is still underway today (thank you Amory Lovins). Outsourcing played a part, but it's a marginal factor not a central driver.
GliderGuider
(21,088 posts)According to data from the World Bank:

American CO2 intensity was flat from 1960 to 1970, and has declined steadily by about 2.25% pa since then. There is no sign of a sudden improvement that could be correlated to the offshoring of manufacturing. The improvement has been steady for 40 years.
China is a different story, one that is tied largely to political events. CO2 intensity improved steadily by 5% pa from 1978 to 2001. Since 2002 it has been flat, presumably because the industrialization enabled by their membership in WTO has been driven by the most abundant and available energy source - coal.
Also according to the World Bank, here is how the economic mix of the two economies has been changing:

happyslug
(14,779 posts)Now, peak is when the total amount of a carbon base energy source is about 1/2 depleted. The significance of peak carbon energy is sometime in the next 50 years we will hit it and the price of carbon fuel goes through the roof cutting its use.
The Planet can recover Carbon from the Atmosphere, but it takes decades and from the report on top of the highest point in Highway we have been putting more carbon into the atmosphere then the atmosphere can remove since at least the 1950s. The rapid increase in price will reduce carbon usage over time. The real question is how long?
Peak Oil: Oil discovery exceeded production till 1980, since 1980s we have pumped more oil then we have found new oil fields. The more traditional definition of peak production is for the period from 2005-2010. The range form 2005-2010 is based on how much faith you have in OPEC numbers, those who have no faith in those number use 2005, those who have faith in the numbers of the seven sisters, put it at 2010. People who believe in the numbers form OPEC thinks 2030.
Natural Gas:
Unlike Oil and Coal, Natural gas can be found below 20,000 feet (Oil is converted by the heat of the earth to Natural Gas if oil goes below 20,000 feet). Unlike oil and Natural gas, Coal was made from ancient forests on ancient shoreline or further inland. Such lands tend to have been be on Continental shelves and thus when continents hit each other OR over run Ocean bottoms, such land tends to stay in the upper regions of the earth. Natural Gas and oil are the product of ancient Algae what died out over shadow seas, and as such ancient seas more likely to go down when the land their are attached to interact with another continent. In simple terms, most coal, like all oil is located above 20,000 feet, the reasons are different, but anything to deep in Natural Gas only.
http://en.wikipedia.org/wiki/Peak_gas
Peak Coal: Peak coal in terms of Energy was in 1997, but in tons of coal produced it has continued to increase. This is the result of replacing higher energy content Bituminous Coal with lower energy Lignite coal from the US West.
http://www.energywatchgroup.org/fileadmin/global/pdf/EWG_Report_Coal_10-07-2007ms.pdf
Peak coal is estimated 2150, but that is considered a very optimistic figure, many other analysts give much earlier dates for every nation. Worse, getting at these coal reserves may require more energy then the coal itself can produced, i.e.
http://en.wikipedia.org/wiki/Peak_coal
http://www.energywatchgroup.org/fileadmin/global/pdf/EWG_Report_Coal_10-07-2007ms.pdf
Thus, peak actual production of carbon energy may incur well before the planet gets to hot. The numbers are up in the air, peak carbon production may NOT occur within the next 20 years, but I have more faith in Peak Carbon Energy then anything we do in terms of Government or Solar and wind power.
GliderGuider
(21,088 posts)That's the only think I know of that might really help in the long run. We're cooked already, of course, but the longer we keep trying to fix things, the more cooked we become. We (and the rest of life on the planet) need some event that is big enough to keep us from "fixing" things any more.
happyslug
(14,779 posts)The West Antarctic Ice Sheet (WAIS) is called the Godzilla of Global warming. It is capable (and appears to have done so just before the start of the last Ice Age) to have collapsed. Within a month, world wide sea levels would raise 20 feet. This would flood most refineries, which tend to be on the coasts (This includes the refineries in New Jersey as while as Texas).
The West Coast refineries tend to be located on higher ground, mostly do to the fact the North American Plate is overriding the Pacific Ocean plate and thus at the coast you have a rapid increase in height from the coast (as compared to Texas the the East Coast which tends to have a much more gradual increase in attitude as you go from the coast.
Other refineries around the world tend to have the same problem, with exception of Russia, which tended to build their refineries closer to their Siberian Oil Fields as oppose to being on the coast (mostly due to lack of coastal areas in Russia that is Ice Free most of the year).
Iran would be another exception, but the Shah refused to build refineries and since the 1989 revolution the hostility of the US to the Iranian Government has kept the number of refineries in Iran low (so low that Iran has to import most REFINED oil products, as they export crude oil).
Kuwait had massive refineries, but within the 20 feet increase in sea level danger (unlike Iran, its coast line is gradual).
I know you understand that 20 feet in sea level raise means 20 feet in HEIGHT, not LENGTH, but the following paragraph is for people who do NOT understand that difference (and other people other then you may read this thread and thus I have to do the following paragraph).
Remember, we are talking about increase in sea level HEIGHT, not LENGTH. A 20 feet increase in HEIGHT can be miles in terms of LENGTH (Classic case is look at the following map for Florida). In most of the world, we may lost up to a mile from the coast. Much less on the West Coast. Also remember the following map is using 7 meters, which is about 20 feet. I will NOT do an exact calculation for the error in the estimate of sea level raise exceeds the error in using 20 feet for 7 meters.
http://geology.com/sea-level-rise/
A seven meter raise does not look that bad, but it will have serious affect on refineries on the coast, ports along the coasts and even off shore oil platforms (even the floating ones are NOT designed for that much of a PERMANENT increase in sea level and thus will have to be rebuilt). Such an rapid increase in sea level no one is planning for, for to do so would mean major rebuilding of infrastructure. On the other hand, lack of such infrastructure would lead to a rapid decline in international trade, as first REFINED oil goes into shortage do to a lack of refineries and then all other trade dies do to a lack of oil AND ports such trade need.
Think about it, no oil (and what oil that will be avalible will be restricted to emergenchy services OR so high in price that no one could afford it). Most Coal mining today is dependent on oil, thus coal mining will fall (as will Natural Gas drilling). That is enough t through the whole world into economic collaspe, and I do NOT see either President Obama OR the Congress of the US being able to handle it (and the Military will stay out, for it would not be able to handle the situation either).
The WAIS is unstable, but has been unstable since the Collapse of the North American Ice Sheet 10,000 years ago. No gradual change if it goes, you would have a rapid change, almost over night.
More on the WAIS and its potential to collapse:
http://geology.com/sea-level-rise/

phantom power
(25,966 posts)but hey, as long as everybody's on board with hating on radiation, I'm sure it will all work out.