Welcome to DU! The truly grassroots left-of-center political community where regular people, not algorithms, drive the discussions and set the standards. Join the community: Create a free account Support DU (and get rid of ads!): Become a Star Member Latest Breaking News General Discussion The DU Lounge All Forums Issue Forums Culture Forums Alliance Forums Region Forums Support Forums Help & Search
3 replies = new reply since forum marked as read
Highlight: NoneDon't highlight anything 5 newestHighlight 5 most recent replies
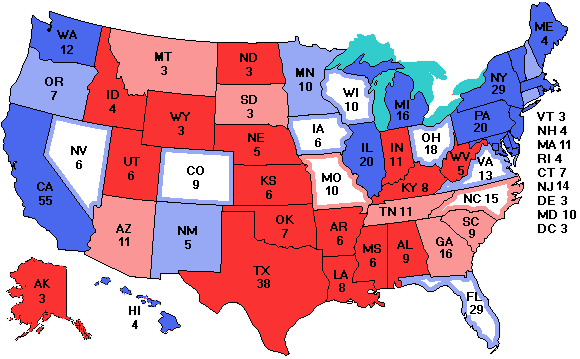
Electoral Map: 9/17/2008 vs 9/17/2012 (Original Post) NYC Liberal Sep 2012 OP
Seems the Numbers of the fredamae Sep 2012 #1
Yes. States gained/lost electoral votes after the 2010 Census. Drunken Irishman Sep 2012 #3
I know 2008 was the last time I paid any attention to that site Warpy Sep 2012 #2
 

Drunken Irishman

(34,857 posts)
3. Yes. States gained/lost electoral votes after the 2010 Census.
Mon Sep 17, 2012, 05:45 PM
Sep 2012

States Obama won last go around lost more electoral votes than states McCain won.

But it also means Ohio is becoming less influential. In 1980, Ohio had 25 electoral votes. They now have only 18.

Warpy

(111,255 posts)
2. I know 2008 was the last time I paid any attention to that site
Mon Sep 17, 2012, 05:15 PM
Sep 2012

and probably over that map that showed NM leaning GOP. Polls here in the state were giving it to Obama by double digits and in fact, we did go blue by nearly 15%.

They don't seem to pay much attention to the quality of the polls they use. If it calls itself a poll, it's averaged with the rest, no matter if it's a right wing push poll calling only Republicans.

Latest Discussions»Retired Forums»2016 Postmortem»Electoral Map: 9/17/2008 ...