Welcome to DU!
The truly grassroots left-of-center political community where regular people, not algorithms, drive the discussions and set the standards.
Join the community:
Create a free account
Support DU (and get rid of ads!):
Become a Star Member
Latest Breaking News
General Discussion
The DU Lounge
All Forums
Issue Forums
Culture Forums
Alliance Forums
Region Forums
Support Forums
Help & Search
kristopher
kristopher's Journal
kristopher's Journal
May 14, 2013
http://www.theledger.com/article/20130514/EDIT01/130519735/1002/SPORTS?Title=Nuclear-Power-Plants-Freeloading-in-Florida
Nuclear Power Plants: Freeloading in Florida
The rest of the article shows how a "reform" the public is demanding was completely subverted by the nuclear industry.
Nuclear Power Plants: Freeloading in Florida
Published: Tuesday, May 14, 2013 at 12:01 a.m.
Last Modified: Monday, May 13, 2013 at 11:40 p.m.
Lawmakers have reminded us once again who their masters are when they're in session in Tallahassee — and it's not the people of Florida. No, the Florida Legislature serves big business first, and nothing makes the point stronger than the House and Senate votes in the final week of this year's legislative session on what was touted as a reform of the state's nuclear Cost Recovery Act.
The Recovery Act was created by the Legislature in 2006 to help big power companies, particularly Duke Power (formerly Progress Energy) and Florida Power & Light, pay for the design and construction of costly nuclear power plants. The idea was to allow the companies to expand Florida's power-generating capacity on a pay-as-you-go basis, theoretically saving consumers in the long run.
But the law was and is flawed. It does not require the companies to actually build the plants for which they are collecting fees. Most offensive of all, it does not require the companies to reimburse customers if those plants are never built.
So far, Duke Energy and FP&L have collected some $1.5 billion, with most of Duke's portion presumably going toward the construction of two proposed Levy County nuclear power plants. Yet, increasingly it appears Duke has no immediate plans to move forward with the project. Slowed population growth and falling natural gas prices have made the urgency for more nuclear power wane.
MINIMAL OVERSIGHT
The law that ...
http://www.theledger.com/article/20130514/EDIT01/130519735/1002/SPORTS?Title=Nuclear-Power-Plants-Freeloading-in-Florida
May 14, 2013
http://www.resilience.org/stories/2013-04-10/after-record-2012-world-wind-power-set-to-top-300-000-megawatts-in-2013
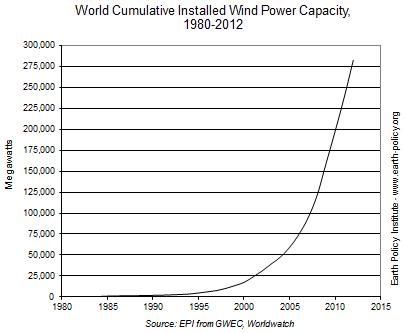
After Record 2012, World Wind Power Set to Top 300,000 Megawatts (300GW) in 2013
After Record 2012, World Wind Power Set to Top 300,000 Megawatts in 2013
by J. Matthew Roney, originally published by Earth Policy Institute | APR 10, 2013
Even amid policy uncertainty in major wind power markets, wind developers still managed to set a new record for installations in 2012, with 44,000 megawatts of new wind capacity worldwide. With total capacity exceeding 280,000 megawatts, wind farms generate carbon-free electricity in more than 80 countries, 24 of which have at least 1,000 megawatts. At the European level of consumption, the world’s operating wind turbines could satisfy the residential electricity needs of 450 million people.
China installed some 13,000 megawatts of wind in 2012, according to the Global Wind Energy Council (GWEC). This was a marked slowdown from the previous two years, when new installations averaged 18,000 megawatts annually. Reasons for the drop-off include concerns about project quality and inadequate electricity transmission and grid infrastructure, which prompted the government to approve fewer projects and to restrict lending. Still, all told, China leads the world with 75,000 megawatts of wind capacity: more than a quarter of the world total.
In a country more readily associated with coal-fired electricity and nuclear power ambitions, wind reached some impressive milestones in China’s energy mix in 2012. Wind-generated electricity increased more than coal-fired electricity did for the first time. Even more remarkable, the electricity produced by wind farms over the course of the year exceeded that produced by nuclear power plants. And this is just the beginning: with massive wind projects under development across its northern and eastern provinces, and 19 ultra-high-voltage transmission projects connecting windy rural areas to population centers (all to be completed by 2014), more milestones lie ahead in China. Consulting firms GTM Research and Azure International project that China will reach 140,000 megawatts of wind by 2015 and nearly 250,000 megawatts by 2020.
The U.S. wind industry made headlines too. More new wind electricity generating capacity was added in 2012 than any other generation technology, including natural gas—a record 13,100 megawatts. An incredible 5,200 megawatts, spread among 59 wind farms, came online in December alone as developers raced to qualify for the federal production tax credit before it expired at the end of the year. The United States remains second only to China, with 60,000 total megawatts of wind capacity—enough to power more than 14 million U.S. homes....
http://www.resilience.org/stories/2013-04-10/after-record-2012-world-wind-power-set-to-top-300-000-megawatts-in-2013
May 13, 2013
http://thinkprogress.org/climate/2013/05/12/1997111/2014-is-looking-to-be-a-7000-megawatt-year-for-wind-power-capacity-and-innovation/
2014 Is Looking To Be A 7,000 Megawatt Year For Wind Power Capacity And Innovation
2014 Is Looking To Be A 7,000 Megawatt Year For Wind Power Capacity And Innovation
By Jeff Spross on May 12, 2013 at 10:35 am

GE's new Brilliant 2.5 megawatt turbine. (Credit: GE)
According to Bloomberg, Warren Buffet’s MidAmerican Energy Holdings Co. is gearing up to drop $1.9 billion on new wind farms in Iowa. The investment might build as many as 656 new turbines by 2015, which would add as much as 1,050 megawatts of wind power capacity to the 2,285 megawatts the company already operates in the state.
The project could also herald a revival in American wind power in general. The anticipated expiration of the production tax credit for wind energy drove a spike in installations in 2012, then a lull into 2013, and finally an anticipated ramp up now that the credit was extended for another year by the fiscal cliff deal.
And because the new extension merely requires projects to start construction by the end of the year to qualify — projects previously had to actually come online by the end of the year to benefit from the credit — GE now expects the full force of the revival to hit in 2014:
Also coming down the pike for wind power is the new version of GE’s Brilliant — a 2.5 megawatt wind turbine, featuring new smart systems and accompanying storage capacity...
By Jeff Spross on May 12, 2013 at 10:35 am
GE's new Brilliant 2.5 megawatt turbine. (Credit: GE)
According to Bloomberg, Warren Buffet’s MidAmerican Energy Holdings Co. is gearing up to drop $1.9 billion on new wind farms in Iowa. The investment might build as many as 656 new turbines by 2015, which would add as much as 1,050 megawatts of wind power capacity to the 2,285 megawatts the company already operates in the state.
The project could also herald a revival in American wind power in general. The anticipated expiration of the production tax credit for wind energy drove a spike in installations in 2012, then a lull into 2013, and finally an anticipated ramp up now that the credit was extended for another year by the fiscal cliff deal.
And because the new extension merely requires projects to start construction by the end of the year to qualify — projects previously had to actually come online by the end of the year to benefit from the credit — GE now expects the full force of the revival to hit in 2014:
Wind-farm developers including NextEra Energy Inc. (NEE) and Invenergy LLC may install 3,000 megawatts to 4,000 megawatts of turbines in the U.S. this year and as much as 7,000 megawatts next year, Anne McEntee, GE’s vice president of renewable energy, said today in an interview.
The U.S. added a record 13,124 megawatts of turbines last year, outpacing natural gas installations for the first time, as wind developers raced to complete projects ahead of the Dec. 31 expiration of the production tax credit. Denmark’s Vestas Wind Systems A/S (VWS) andSpain’s Gamesa Corp Tecnologica SA (GAM) also expect new orders to pick up by the third quarter.…
GE has received orders this year for more than 1,000 megawatts of wind turbines, including one from NextEra for 100.3 megawatts announced today for a Michigan wind farm and Invenergy’s 215-megawatt deal announced last week for a project in Texas.
Also coming down the pike for wind power is the new version of GE’s Brilliant — a 2.5 megawatt wind turbine, featuring new smart systems and accompanying storage capacity...
http://thinkprogress.org/climate/2013/05/12/1997111/2014-is-looking-to-be-a-7000-megawatt-year-for-wind-power-capacity-and-innovation/
May 12, 2013
http://web.mit.edu/newsoffice/2013/wind-power-even-without-the-wind-0425.html
Offshore wind is getting ready to grow a set of real balls
Wind power — even without the wind
Innovative storage system could enable offshore wind farms to deliver power whenever it’s needed.
David L. Chandler, MIT News Office
April 25, 2013
Offshore wind could provide abundant electricity — but as with solar energy, this power supply can be intermittent and unpredictable. But a new approach from researchers at MIT could mitigate that problem, allowing the electricity generated by floating wind farms to be stored and then used, on demand, whenever it’s needed.
The key to this concept is the placement of huge concrete spheres on the seafloor under the wind turbines. These structures, weighing thousands of tons apiece, could serve both as anchors to moor the floating turbines and as a means of storing the energy they produce.
Whenever the wind turbines produce more power than is needed, that power would be diverted to drive a pump attached to the underwater structure, pumping seawater from a 30-meter-diameter hollow sphere. (For comparison, the tank’s diameter is about that of MIT’s Great Dome, or of the dome atop the U.S. Capitol.) Later, when power is needed, water would be allowed to flow back into the sphere through a turbine attached to a generator, and the resulting electricity sent back to shore.
One such 25-meter sphere in 400-meter-deep water could store up to 6 megawatt-hours of power, the MIT researchers have calculated; that means that 1,000 such spheres could supply as much power as a nuclear plant for several hours — enough to make them a reliable source of power. The 1,000 wind turbines that the spheres could anchor could, on average, replace a conventional on-shore coal or nuclear plant. What’s more, unlike nuclear or coal-fired plants, which take hours to ramp up, this energy source could be made available within minutes, and then taken offline just as quickly.
The system would be...
http://web.mit.edu/newsoffice/2013/wind-power-even-without-the-wind-0425.html
May 12, 2013
http://www.eei.org/ourissues/finance/Documents/disruptivechallenges.pdf
See also: Solar Energy: This Is What a Disruptive Technology Looks Like
https://medium.com/armchair-economics/cbc9fdd91209
Disruptive Challenges: Financial Implications and Strategic Responses to a Changing Retail Electric
This paper has spawned a great deal of discussion so I thought some people might like to access the original instead of just reading the derivative articles.
Disruptive Challenges: Financial Implications and Strategic Responses to a Changing Retail Electric Business
Prepared by:
Peter Kind Energy Infrastructure Advocates
Prepared for:
Edison Electric Institute
January 2013
Table of Contents
Executive Summary ........................................................ 1
Background.....................................................................3
Disruptive Threats—Strategic Considerations ........................6
Finance 101 - Introduction to Corporate Finance....................7
Finance 201 - Financial Market Realities................................8
Finance 501 - Financial Implications of Disruptive Forces........11
Telephone Industry Parallels.............................................14
Strategic Implications of Distribution 2020 Disruptive Forces...17
Summary......................................................................19
Executive Summary
Recent technological and economic changes are expected to challenge and transform the electric utility industry. These changes (or “disruptive challenges”) arise due to a convergence of factors, including:
falling costs of distributed generation and other distributed energy resources (DER);
an enhanced focus on development of new DER technologies;
increasing customer, regulatory, and political interest in demand- side management technologies (DSM);
government programs to incentivize selected technologies;
the declining price of natural gas;
slowing economic growth trends;
and rising electricity prices in certain areas of the country.
Taken together, these factors are potential “game changers” to the U.S. electric utility industry, and are likely to dramatically impact customers, employees, investors, and the availability of capital to fund future investment. The timing of such transformative changes is unclear, but with the potential for technological innovation (e.g., solar photovoltaic or PV) becoming economically viable due to this confluence of forces, the industry and its stakeholders must proactively assess the impacts and alternatives available to address disruptive challenges in a timely manner.
This paper considers the financial risks and investor implications related to disruptive challenges, the potential strategic responses to these challenges, and the likely investor expectations to utility plans going forward. There are valuable lessons to be learned from other industries, as well as prior utility sector paradigm shifts, that can assist us in exploring risks and potential strategic responses.
The financial risks created by disruptive challenges include declining utility revenues, increasing costs, and lower profitability potential, particularly over the long-term. As DER and DSM programs continue to capture “market share,” for example, utility revenues will be reduced. Adding the higher costs to integrate DER, increasing subsidies for DSM and direct metering of DER will result in the potential for a squeeze on profitability and, thus, credit metrics. While the regulatory process is expected to allow for recovery of lost revenues in future rate cases, tariff structures in most states call for non-DER customers to pay for (or absorb) lost revenues. As DER penetration increases, this is a cost-recovery structure that will lead to political pressure to undo these cross subsidies and may result in utility stranded cost exposure.
While the various disruptive challenges facing the electric utility industry may have different implications, they all create adverse impacts on revenues, as well as on investor returns, and require individual solutions as part of a comprehensive program to address these disruptive trends. Left unaddressed, these financial pressures could have a major impact on realized equity returns, required investor returns, and credit quality. As a result, the future cost and availability of capital for the electric utility industry would be adversely impacted. This would lead to increasing customer rate pressures.
The regulatory paradigm that has supported recovery of utility investment has been in place since the electric utility industry reached a mature state in the first half of the 20th century...
http://www.eei.org/ourissues/finance/Documents/disruptivechallenges.pdf
See also: Solar Energy: This Is What a Disruptive Technology Looks Like
https://medium.com/armchair-economics/cbc9fdd91209
May 12, 2013
http://www.solarnovus.com/index.php?option=com_content&view=article&id=6516:best-yet-battery-design-to-stabilise-solar-power-for-grid-&catid=52:applications-tech-research&Itemid=247
"Best Yet Battery Design to Stabilise Solar Power for Grid
"Best Yet” Battery Design to Stabilise Solar Power for Grid
WRITTEN BY SANDRA HENDERSON | 05 MAY 2013
...“In this new battery, the positive electrode is concentrated lithium polysulfide in organic solvent and the negative electrode is metallic lithium. The polysulfide solution is stored in a separated tank; when the battery needs to be charged or discharged, the solution would flow to the battery and electrochemical reactions happen. In downtime, the liquid positive electrode stays in the tank,” explains Yi Cui, an associate professor at Stanford and member of the Stanford Institute for Materials and Energy Sciences (SIMES). “This design is easy to scale up. The materials, such as lithium and sulphur and solvent, are all relatively cheap.”
The new battery furthermore solves the low energy density issue. Traditional flow batteries used in grid-scale energy storage, such as vanadium flow battery (VRB), typically display low solubility of active materials in water solvents, and the voltage is limited by the small stability-window of water (1.23 V). “In our new system, the solubility of active materials is much higher than VRB. The voltage is also close to twice of that of conventional flow batteries,” Cui says.
The most expensive component in previous system designs is the ion-selective membrane widely used in flow batteries to keep two electrolytes from intermixing. “By forming a high-quality passivation layer on the surface of the lithium negative electrode, the direct chemical reaction between lithium and the polysulfide solution is avoided and the system is free-of-membrane,” Cui says. This new approach could significantly lower the overall cost of the system further, which could reduce the total cost of electricity generated from solar compared with other energy storage systems.”
In lab tests, Cui and his team achieved 2400 cycles with an energy density of 37 Wh/L and 1500 cycles with an energy density of 71 Wh/L. According to the nanoscale materials expert with a PhD from Harvard, 2400 cycles is equivalent to 6.6-year operation, based on daily operation. “The energy density of our batteries is likely to go much higher over time, which will help reduce the cost greatly,” he says. The energy density of traditional vanadium flow battery by comparison is only 30 Wh/L, indicating that the cycling and energy density of the new system are “very attractive for grid-level application,” making it an “attractive candidate for large-scale energy storage, such as solar power plants, wind farms and buildings.” The system’s low-cost materials combined with a long cycle life and high energy density could enable the intermittent solar energy to become a stable supply of grid electricity. “The simple design also significantly reduces the cost of energy storage and its applications can be extended to other stationary energy storage systems such as those used in load balancing and peak shaving for the grid,” Cui adds.
Confident about...
http://www.solarnovus.com/index.php?option=com_content&view=article&id=6516:best-yet-battery-design-to-stabilise-solar-power-for-grid-&catid=52:applications-tech-research&Itemid=247
May 11, 2013
http://www.greentechmedia.com/articles/read/all-new-generation-in-california-system-for-2h-2013-to-be-solar-and-biomass?utm_source=Solar&utm_medium=Picture&utm_campaign=GTMDaily
California: Solar to account for 97% of new generation in 2nd half 2013
Solar to Account for Almost All New Generation in California System in 2H 2013
HERMAN K. TRABISH: APRIL 30, 2013
Almost all of the new generation capacity in the California transmission system operator’s queue for the second half of 2013 is solar -- 97 percent, to be exact.
There are 1,633 megawatts of new generation capacity in the 2H 2013 queue, according to the 2012 Annual Report on Market Issues and Performance from the California Independent System Operator (the ISO). Of that, 1,581 megawatts are new solar and 52 megawatts are biomass.
By the end of the first half of the year, the ISO will have added 3,391 megawatts of nameplate capacity, of which 2,296 megawatts will be natural gas, 565 megawatts will be wind and 530 megawatts will be solar.
However, what is in the ISO’s queue is not necessarily what will end up in the state’s energy mix, REC Solar Director of Governmental Affairs Ben Higgins pointed out.
But in this report...
http://www.greentechmedia.com/articles/read/all-new-generation-in-california-system-for-2h-2013-to-be-solar-and-biomass?utm_source=Solar&utm_medium=Picture&utm_campaign=GTMDaily
May 10, 2013
http://www.renewableenergyworld.com/rea/blog/post/2013/05/report-anticipates-220-new-gigawatts-of-distributed-solar-generation-by-2018?cmpid=SolarNL-Tuesday-May7-2013
Today's solar technology is already kicking ass...
Report Anticipates 220 New Gigawatts of Distributed Solar Generation by 2018
By Chris Meehan
May 6, 2013
A recent Navigant Research report anticipates that the world will add 220 new gigawatts of distributed solar photovoltaics by 2018 as solar comes into parity with other energy sources, creating $540.3 billion in revenue in the process. That’s a significant jump in the amount of solar that is currently installed throughout world, which the European Photovoltaic Industry Association (EPIA) said reached 100 gigawatts at the end of 2012.
In recent years, much of the growth in solar is attributable to the giant PV projects being installed to meet utility demand in certain markets. The Navigant report anticipates that just the distributed generation projects — or projects under 1 megawatt in size — being installed over the next five years will more than double the world’s total solar capacity that is now online.
...The report anticipates that the solar market is transitioning from one that relies on a financial and engineering model (based on the wants and needs of utilities to own or source electric generation from large projects) to a more diverse model. Under the emerging model, both the sources of generation and the ownership of the generation assets will be more diverse, include third-party financing from companies like SolarCity and SunRun and other new financing mechanisms. These changes will partly be driven by some of distributed solar’s advantages, which include generating electricity onsite to offset the need to build new transmission capacity while avoiding line losses, according to Navigant.
Navigant also finds that the growth will occur as both PV modules and the balance of systems costs (i.e., soft costs and other costs not related directly to the modules and inverter) continue to fall, driving the installed costs of PV to between $1.76 per watt to $2.74 per watt throughout the world. “At this price, solar PV will largely be at grid parity, without subsidies, in all but the least expensive retail electricity markets,” it says.
The report also notes ...
http://www.renewableenergyworld.com/rea/blog/post/2013/05/report-anticipates-220-new-gigawatts-of-distributed-solar-generation-by-2018?cmpid=SolarNL-Tuesday-May7-2013
May 10, 2013
http://www.renewableenergyworld.com/rea/blog/post/2013/05/report-anticipates-220-new-gigawatts-of-distributed-solar-generation-by-2018?cmpid=SolarNL-Tuesday-May7-2013
Report Anticipates 220 New Gigawatts of (just!) Distributed Solar Generation by 2018
Report Anticipates 220 New Gigawatts of Distributed Solar Generation by 2018
By Chris Meehan
May 6, 2013
A recent Navigant Research report anticipates that the world will add 220 new gigawatts of distributed solar photovoltaics by 2018 as solar comes into parity with other energy sources, creating $540.3 billion in revenue in the process. That’s a significant jump in the amount of solar that is currently installed throughout world, which the European Photovoltaic Industry Association (EPIA) said reached 100 gigawatts at the end of 2012.
In recent years, much of the growth in solar is attributable to the giant PV projects being installed to meet utility demand in certain markets. The Navigant report anticipates that just the distributed generation projects — or projects under 1 megawatt in size — being installed over the next five years will more than double the world’s total solar capacity that is now online.
...The report anticipates that the solar market is transitioning from one that relies on a financial and engineering model (based on the wants and needs of utilities to own or source electric generation from large projects) to a more diverse model. Under the emerging model, both the sources of generation and the ownership of the generation assets will be more diverse, include third-party financing from companies like SolarCity and SunRun and other new financing mechanisms. These changes will partly be driven by some of distributed solar’s advantages, which include generating electricity onsite to offset the need to build new transmission capacity while avoiding line losses, according to Navigant.
Navigant also finds that the growth will occur as both PV modules and the balance of systems costs (i.e., soft costs and other costs not related directly to the modules and inverter) continue to fall, driving the installed costs of PV to between $1.76 per watt to $2.74 per watt throughout the world. “At this price, solar PV will largely be at grid parity, without subsidies, in all but the least expensive retail electricity markets,” it says.
The report also notes ...
By Chris Meehan
May 6, 2013
A recent Navigant Research report anticipates that the world will add 220 new gigawatts of distributed solar photovoltaics by 2018 as solar comes into parity with other energy sources, creating $540.3 billion in revenue in the process. That’s a significant jump in the amount of solar that is currently installed throughout world, which the European Photovoltaic Industry Association (EPIA) said reached 100 gigawatts at the end of 2012.
In recent years, much of the growth in solar is attributable to the giant PV projects being installed to meet utility demand in certain markets. The Navigant report anticipates that just the distributed generation projects — or projects under 1 megawatt in size — being installed over the next five years will more than double the world’s total solar capacity that is now online.
...The report anticipates that the solar market is transitioning from one that relies on a financial and engineering model (based on the wants and needs of utilities to own or source electric generation from large projects) to a more diverse model. Under the emerging model, both the sources of generation and the ownership of the generation assets will be more diverse, include third-party financing from companies like SolarCity and SunRun and other new financing mechanisms. These changes will partly be driven by some of distributed solar’s advantages, which include generating electricity onsite to offset the need to build new transmission capacity while avoiding line losses, according to Navigant.
Navigant also finds that the growth will occur as both PV modules and the balance of systems costs (i.e., soft costs and other costs not related directly to the modules and inverter) continue to fall, driving the installed costs of PV to between $1.76 per watt to $2.74 per watt throughout the world. “At this price, solar PV will largely be at grid parity, without subsidies, in all but the least expensive retail electricity markets,” it says.
The report also notes ...
http://www.renewableenergyworld.com/rea/blog/post/2013/05/report-anticipates-220-new-gigawatts-of-distributed-solar-generation-by-2018?cmpid=SolarNL-Tuesday-May7-2013
May 9, 2013
More at: http://thinkprogress.org/climate/2011/04/06/207833/does-nuclear-power-have-a-negative-learning-curve/
See also:
http://thinkprogress.org/climate/2013/05/06/1966071/four-must-see-charts-show-why-renewable-energy-is-disruptive-in-a-good-way/
Does nuclear power have a negative learning curve?
Does nuclear power have a negative learning curve?
By Joe Romm on Apr 6, 2011 at 4:05 pm
‘Forgetting by doing’? Real escalation in reactor investment costs
We’ve known for a while that the cost of new nuclear power plants in this county have been soaring (see Nuclear power: The price is not right and Exclusive analysis: The staggering cost of new nuclear power).
Before 2007, price estimates of $4000/kw for new U.S. nukes were common, but by October 2007 Moody’s Investors Service report, “New Nuclear Generation in the United States,” concluded, “Moody’s believes the all-in cost of a nuclear generating facility could come in at between $5,000 – $6,000/kw.” That same month, Florida Power and Light, “a leader in nuclear power generation,” presented its detailed cost estimate for new nukes to the Florida Public Service Commission. It concluded that two units totaling 2,200 megawatts would cost from $5,500 to $8,100 per kilowatt “” $12 billion to $18 billion total! In 2008, Progress Energy informed state regulators that the twin 1,100-megawatt plants it intended to build in Florida would cost $14 billion, which “triples estimates the utility offered little more than a year ago.” That would be more than $6,400 a kilowatt. (And that didn’t even count the 200-mile $3 billion transmission system utility needs, which would bring the price up to a staggering $7,700 a kilowatt).

<snip>
Why did the costs escalate? Why was there “negative learning.” He offers this theory:
<snip>
In fact, the cost of new nuclear power plant have continued to escalate in the United States, France, and other countries since 2000:
Indeed the Toronto Star “” published these stunning details in Canada’s largest daily newspaper about Areva’s Ontario bid:
By Joe Romm on Apr 6, 2011 at 4:05 pm
‘Forgetting by doing’? Real escalation in reactor investment costs
We’ve known for a while that the cost of new nuclear power plants in this county have been soaring (see Nuclear power: The price is not right and Exclusive analysis: The staggering cost of new nuclear power).
Before 2007, price estimates of $4000/kw for new U.S. nukes were common, but by October 2007 Moody’s Investors Service report, “New Nuclear Generation in the United States,” concluded, “Moody’s believes the all-in cost of a nuclear generating facility could come in at between $5,000 – $6,000/kw.” That same month, Florida Power and Light, “a leader in nuclear power generation,” presented its detailed cost estimate for new nukes to the Florida Public Service Commission. It concluded that two units totaling 2,200 megawatts would cost from $5,500 to $8,100 per kilowatt “” $12 billion to $18 billion total! In 2008, Progress Energy informed state regulators that the twin 1,100-megawatt plants it intended to build in Florida would cost $14 billion, which “triples estimates the utility offered little more than a year ago.” That would be more than $6,400 a kilowatt. (And that didn’t even count the 200-mile $3 billion transmission system utility needs, which would bring the price up to a staggering $7,700 a kilowatt).
<snip>
Why did the costs escalate? Why was there “negative learning.” He offers this theory:
… with increasing application (“doing”), the complexity of the technology inevitably increases leading to inherent cost escalation trends that limit or reverse “learning” (cost reduction) possibilities. In other words, technology scale-up can lead to an inevitable increase in systems complexity (in the case of nuclear, full fuel cycle management, load-following operation mode, and increasing safety standards as operation experience [and unanticipated problems] are accumulating) that translates into real-cost escalation, or “negative learning” in the terminology of learning/ experience curve models. The result may be a much wider cost variation across different technologies than so far anticipated.
<snip>
In fact, the cost of new nuclear power plant have continued to escalate in the United States, France, and other countries since 2000:
- French nuclear giant “Areva has acknowledged that the cost of a new reactor today would be as much as 6 billion euros, or $8 billion, double the price offered to the Finns.” (5/09)
- Toshiba tells San Antonio its new twin $13 billion nukes will cost $4 billion more. The city balks. (10/09)
- Nuclear Bombshell: $26 Billion cost “” $10,800 per kilowatt! “” killed Ontario nuclear bid (7/09)
Indeed the Toronto Star “” published these stunning details in Canada’s largest daily newspaper about Areva’s Ontario bid:
- AECL’s $26 billion bid was based on the construction of two 1,200-megawatt Advanced Candu Reactors, working out to $10,800 per kilowatt of power capacity….
More at: http://thinkprogress.org/climate/2011/04/06/207833/does-nuclear-power-have-a-negative-learning-curve/
See also:
Four Must-See Charts Show Why Renewable Energy Is Disruptive – In A Good Way
By Ryan Koronowski on May 6, 2013


By Ryan Koronowski on May 6, 2013
http://thinkprogress.org/climate/2013/05/06/1966071/four-must-see-charts-show-why-renewable-energy-is-disruptive-in-a-good-way/
Profile Information
Member since: Fri Dec 19, 2003, 02:20 AMNumber of posts: 29,798