NNadir
NNadir's JournalWell, folks, we "got there:" The first weekly average CO2 concentration over 420 ppm at Mauna Loa.
As I've indicated several times I somewhat obsessively keep a spreadsheet of the weekly data at the Mauna Loa Carbon Dioxide Observatory, which I use to do calculations to record the dying of our atmosphere, a triumph of fear, dogma and ignorance that did not have to be, but nonetheless is.
This week's reading is the first in the history of weekly average readings, going back, to 1975 posted by the Mauna Loa is the highest ever recorded at the Mauna Loa carbon dioxide observatory, 420.01 ppm.
Generally, each year, these measurements peak in late May or early June. We probably haven't seen the worst measurement of 2021 yet, despite all the enthusiasm for the idea that Covid lockdowns would slow climate change. If they did, it's imperceptible.

The figures for this past week:
Week beginning on April 25, 2021: 420.01 ppm
Weekly value from 1 year ago: 416.95 ppm
Weekly value from 10 years ago: 393.48 ppm
Last updated: May 2, 2021
Up-to-date weekly average CO2 at Mauna Loa
The increase in carbon dioxide concentrations when compared to the same week in 2020 is "only" 3.04 ppm. (If one keeps track as I do, there is a fair amount of statistical noise in these measurements, but the trends are consistent.) The highest weekly increase over 2020 this year, 2021, was 3.90 ppm, observed in the week beginning February 28, 2021.
In my spreadsheet, I keep records of the increases over 10 year periods, in this case, a comparison of the reading this past week, with the last week of May in 2011. Using Excel functions, I can sort them by values high to low and do a lot of other things. The value for the 10 year increase is the highest ever recorded, 26.53 ppm.
The 12 month running average for increases over a ten year period, week to week, 2021 to 2011, is 24.37 ppm, 2.44 ppm per year and rising.
If any of this troubles you, don't worry, be happy. Head on over to Benny Sovacool's paper in Environmental Science and Technology about how so called "renewable energy" could save as many lives as nuclear energy saves, and could prevent as much carbon dioxide emissions as nuclear energy has been doing consistently for decades if only...if only...if only...if only...
If only what, exactly?
Positive Externalities of Decarbonization: Quantifying the Full Potential of Avoided Deaths and Displaced Carbon Emissions from Renewable Energy and Nuclear Power (Benjamin K. Sovacool and Chukwuka G. Monyei, Environmental Science & Technology 2021 55 (8), 5258-5271.
I discussed "Benny boy's" paper last night, with my head about to explode, because I'm sick and tired of hearing what so called "renewable energy" could do. I've been hearing it for half a century, and here we are...here we are...
The anti-nuke squad tries to steal Jim Hansen's thunder and manages to look stupid again.
At least it does seem that "Benny Boy" finally may have conceded, after spending his entire adult life bashing nuclear energy, that it saves lives.
That doesn't stop him from repeating his cult mantras that so called "renewable energy" is the bestest bestest best yet, even if we have to put dredging mines to haul up metal ores from the seafloor to get materials to convert our last wilderness into industrial parks for wind turbines.
Guess what? So called "renewable energy" hasn't done anything. It isn't doing anything. It won't do anything, where "anything" is saving human lives from air pollution and addressing climate change.
It's not "we could hit 420 ppm concentrations of the dangerous fossil fuel waste carbon dioxide in the planetary atmosphere;" It's "we did hit 420 ppm concentrations of the dangerous fossil fuel waste carbon dioxide in the planetary atmosphere." We did this after half a century of cheering wildly for wind and solar energy.
The history of the reactionary attempt to go to a so called "renewable energy" powered world like the one abandoned by humanity in the 19th and early 20th century, this on a planet with 1/7th the population it supports now, is filled with conditional "could" statements. And it's not about money, because we've been throwing oodles of money at so called "renewable energy" for this entire century, on a scale of trillions of dollars:
The amount of money "invested" in so called "renewable energy" in the period between 2004 and 2018 is over 3.036 trillion dollars; dominated by solar and wind which soaked up 2.774 trillion dollars.
Source: UNEP/Bloomberg Global Investment in Renewable Energy, 2019
The result of spending all of this money has had no result with respect to addressing climate change, other than the result that as a result of this squandering on stuff about which we liked to talk but didn't work - that's the only word for it, "squandering" - we're at 420 ppm.
That's a fact.
Facts matter.
This isn't a popular statement, necessarily, among my fellow Democrats - and I've gotten in lots of trouble for making it even as I insist it is true - but the reality is that opposing nuclear energy is rapidly morphing into a crime against humanity.
Have a nice Sunday afternoon.
A Spectroscopic View on Cosmic Polycyclic Aromatic Hydrocarbon (PAH) Emissions
The paper I'll discuss in this post is this one: A Spectroscopic View on Cosmic PAH Emission (Els Peeters, Cameron Mackie, Alessandra Candian, and Alexander G. G. M. Tielens, Accounts of Chemical Research 2021 54 (8), 1921-1933)
Accounts of Chemical Research is a journal to which I used to subscribe, in the old days of paper journals, when I was a kid. Over the years I sort of drifted away from it, although it's a magnificent journal, as I see whenever I do get around to looking at it, ably edited by one of the best professors from whom I ever took a class, where I learned all about cycloadditions. She must be nearing retirement now.
PAHs on Earth are responsible, mechanistically, for a large portion of the deaths from combustion wastes, both from the combustion of dangerous fossil fuels and the combustion of biomass, including, but hardly limited to, tobacco. This is because they are planar molecules, often with oxidizable oxygen functional groups. Because they are planar, they can fit in the grooves of DNA, sometimes bonding to the nitrogen bases causing adducts that can and do lead to cancer, and other diseases.
This account is not about air pollution or even terrestrial life, but is about the formation of these molecules in deep space and their chemistry there. The abstract contains this wonderful statement:
From the introduction to the paper:
 13)). While aromatic species such as benzene, benzonitrile, and fullerenes (C60 and C70) have been detected in space,(14?17) identification of specific members of this PAH family (or classes within) remains a mystery.
They are very involved in the chemistry of space:
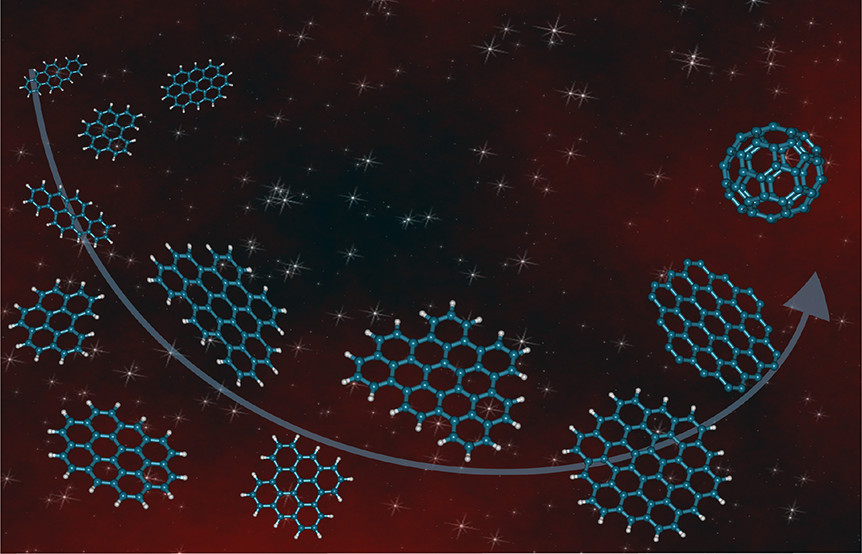
Pictures from the text, beginning with the advertising graphic that has a nice picture of PAH planar structures, as well as the obviously non-planar fullerene which has also been observed in space:
The caption:

The caption:
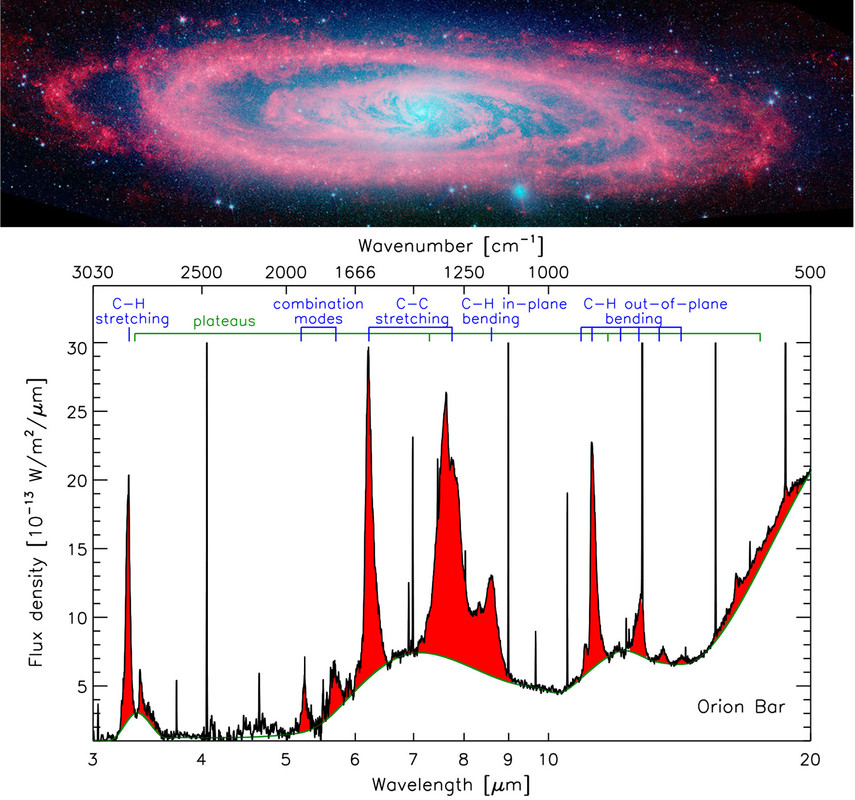
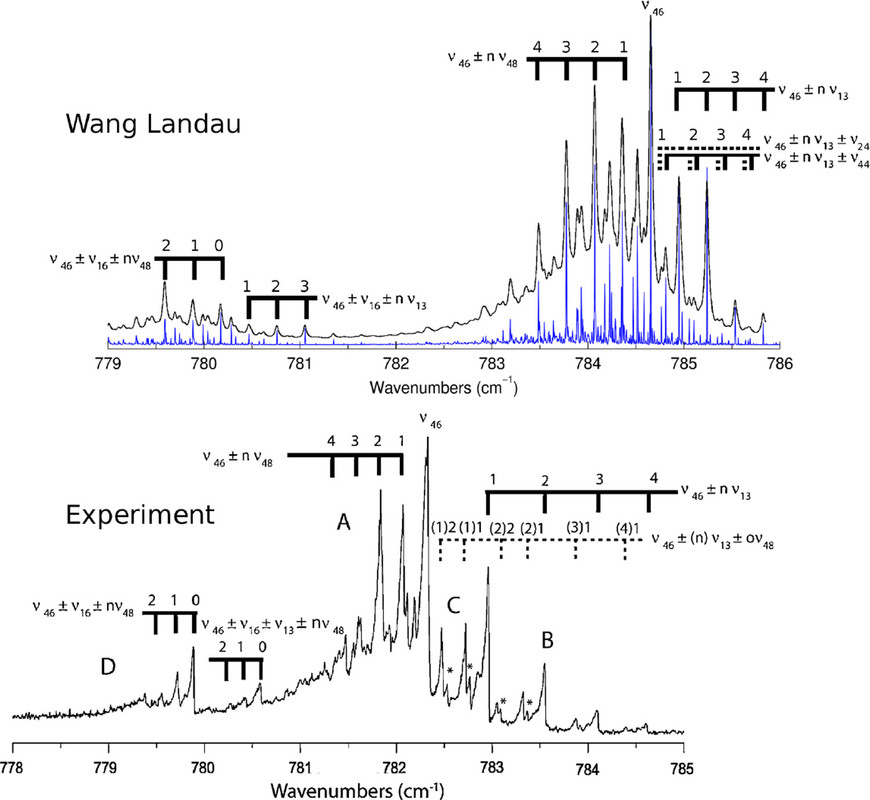
Figure 2. Spectroscopic variation in the 6–9 ?m? (1666–1111 cm–1) PAH emission. Profiles are normalized to the peak intensity (Jy) in the 8 ?m? (1250 cm–1) region. Strong aliphatic emission at 6.9 and 7.25 ?m? (1449 and 1379 cm–1, purple) is seen in class . Class is represented by IRAS 23133 + 6050, class by HD 44179, class by IRAS 13416-6243, and class by IRAS f05110-6616. Adapted with permission from ref (26). Copyright 2002 EDP Sciences.
The caption:
The caption:
The caption:
The caption:
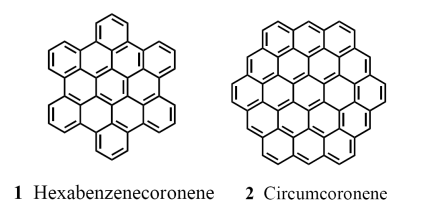
Here is the structure of one of the molecules described below, circumcoronene and a related molecule:
Here is the structure of another of the molecules described below, Circumcircumcoronene:

I have never worked on the synthetic chemistry of PAHs, but I'd guess, even with their high symmetry, these are non-trivial molecules to make. When I was a kid, there were all kinds of very smart people around trying to synthesize fullerene, mostly unsuccessfully. The Nobel Prize winning work of its discovery found that it is a component of lampblack.
(Today there's all kinds of fullerene chemistry going on.)
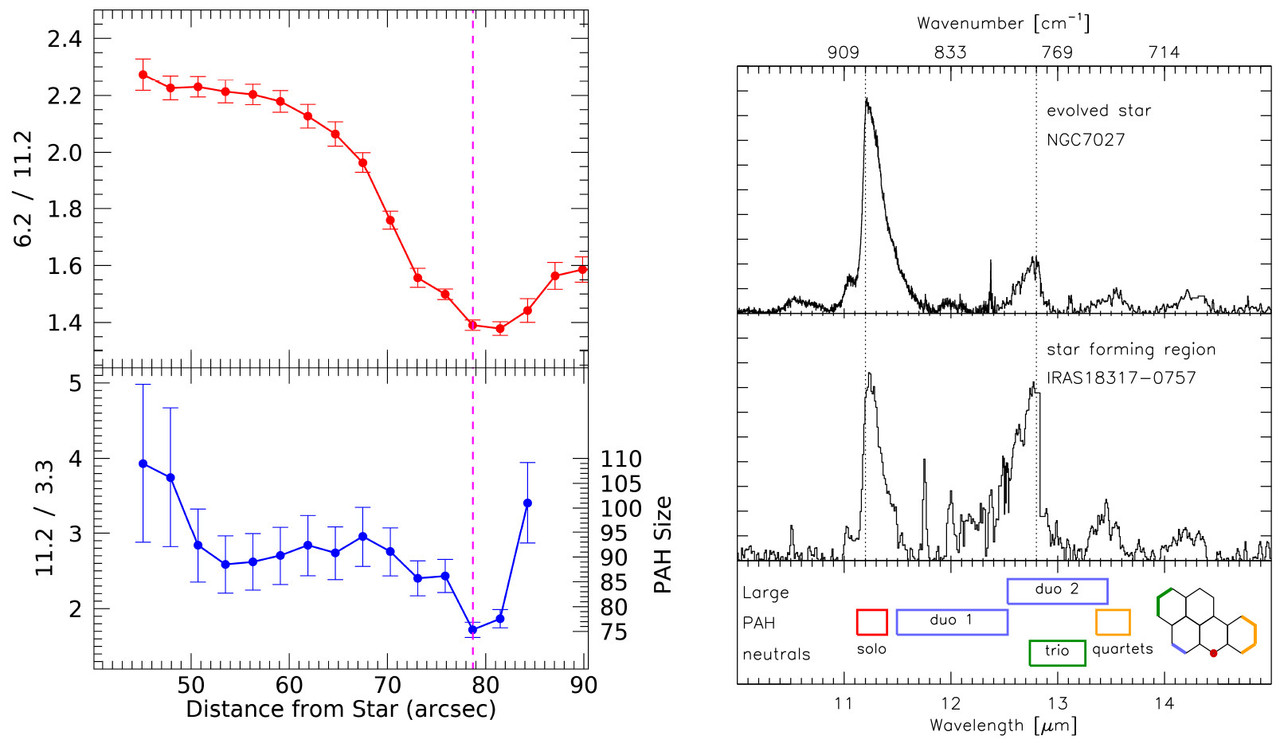
The last graphic from the paper:
The caption:
Recently, during the Q&A section of a talk at the virtual ACS meeting on the subject of the origins of life, which focused on showing that it originated on this planet, I made a case for the panspermic theory that the molecules of life, if not life itself, originated in space. The speaker dismissed my question with a remark that amounted to, "I don't study that, so your question is not worth addressing."
Oh well then.
One thing is certain, astrochemistry is a rich field with much to learn.
I'm not a "let's all take a ride to Mars with Elon Musk and inhabit it and build cities and make oxygen, because well, we've wrecked this planet" kind of guy.
I think in most cases robots in space do a better job than humans, more safely, at less cost. Although I'm convinced we need to focus our attention on the air above us, the water we drink, and the land beneath our feet, I also believe that the highest purpose of humanity is to extend our vision.
I was glad to learn about the James Webb telescope through this paper.
Have a nice day.
The anti-nuke squad tries to steal Jim Hansen's thunder and manages to look stupid again.
In 2013, the famous climate scientist, Jim Hansen, working with lead author Pushker A. Kharecha published a now fairly famous and widely cited paper showing that nuclear power saves lives: Prevented Mortality and Greenhouse Gas Emissions from Historical and Projected Nuclear Power( Pushker A. Kharecha and James E. Hansen
Environmental Science & Technology 2013 47 (9), 4889-4895).
Almost immediately, the "renewables will save us" anti-nukes Benjamin Sovacool, and filer of lawsuits against PNAS, Mark Z. Jacobson, piped in to say that "nuclear energy is too expensive...too dangerous...blah...blah...blah..." and that wind and solar and finding whatever rivers are left to destroy and destroying them, would save the world better than nuclear could. (Jacobson's lawsuit against PNAS involved PNAS publishing a criticism authored by a plethora of other scientists, including some at his own institution, of his "renewable energy will save the world," paper published in um, PNAS, suggesting that his "save the world" ideas wouldn't work.) Apparently neither 1.8 million lives (as of 2013) already saved by nuclear power were "too expensive" and "too dangerous." This took place in the comments section of a subsequent issue of EST.
Kharecha and Hansen's dismissal of their whining was a joy to behold.
Of course, I've been hearing my whole adult life that "renewable energy will save the world," and I'm certainly not young. It's been going on loudly, pronounced by anti-nukes like Sovacool but it hasn't done shit to save lives historically. Since 2013, eight years ago, somewhere around 50 million people lost their lives to air pollution, this while trillion dollar quantities of money were thrown at solar and wind fantasies for no result.
Global, regional, and national comparative risk assessment of 79 behavioural, environmental and occupational, and metabolic risks or clusters of risks, 1990–2015: a systematic analysis for the Global Burden of Disease Study 2015 (Lancet 2016; 388: 1659–724) One can easily locate in this open sourced document compiled by an international consortium of medical and scientific professionals how many people die from causes related to air pollution, particulates, ozone, etc.
Now Sovacool, is pretending to have a brain by parroting Hansen's methodology and applying it to putative solar and wind fantasies that haven't come, aren't here, and won't be here at any time on any scale that is meaningful despite more than half a century of loud cheering: Positive Externalities of Decarbonization: Quantifying the Full Potential of Avoided Deaths and Displaced Carbon Emissions from Renewable Energy and Nuclear Power (Benjamin K. Sovacool and Chukwuka G. Monyei, Environmental Science & Technology 2021 55 (8), 5258-5271.
Let me reprint the title of their paper: Positive Externalities of Decarbonization: Quantifying the Full Potential of Avoided Deaths and Displaced Carbon Emissions from Renewable Energy and Nuclear Power.
The italics and bold in the repeated title are mine.
It is worth noting that Kharecha's and Hansen's paper included the word "historical," which means that it's based on real data, and not modeling or projection.
I have called up the full text of this appalling paper of Sovacool's. Nowhere in it do the words "steel" or "copper" or "lanthanides" (or the oft used term for "lanthanides," "rare earths" ) appear. No LCA (life cycle analysis) is mentioned except to cite a single 2008 paper (among thousands of papers) about the LCA of nuclear energy, with no data from it reported in the text. Um, firing up a steel retort filled with coke made by heating coal with coal does in fact, kill people, in normal operations.
I know from experience with reading Benny-boy's tripe that he himself knows essentially zero about nuclear engineering, or for that matter, nuclear fuel. (I've read his Ph.D. thesis which involved among other things, interviewing anonymous power company executives.)
It took Sovacool 8 years, again measured by 50 million air pollution deaths, to come up with this list of offering, in lieu of real data about real energy produced, a list of scenarios, about so called "renewable energy," "could" do if only this or only that... All of these scenarios have been falling by the wayside decade after decade while people die and the atmosphere collapses, wildernesses are destroyed to chase after bourgeois fantasies, poor people are consigned to dig cobalt for electric cars and otherwise ignored, etc., etc., etc.
This statement from the paper is as fallacious as a statement that chloroquinine cures Covid:
The use of every fossil fuel in this century has been rising, not falling, and gas is hardly "transitional" - this is the really, really, really big lie - because the increase in the use of gas has been vastly outstripping the use (measured in units of energy, exajoules) much faster than all the solar and wind energy generated on the planet.
Here is the data posted this morning of the Mauna Loa Carbon Dioxide Observatory over the last 5 days as of this writing:
April 30: 420.54 ppm
April 29: 419.85 ppm
April 28: 419.75 ppm
April 27: 419.49 ppm
April 26: 420.01 ppm
Last Updated: May 1, 2021
Recent Daily Average Mauna Loa CO2 (Accessed 5/2/21, 12:01 pm)
The first time we ever saw a weekly average reading higher than 400 ppm (400.03 ppm), was on May 26, 2013, the year Hansen's paper was published. Less than 8 years later, we're scraping 420 ppm.
In the year 2000, around the time that Benny Boy types and their cohorts got their way in a major industrial nation when Germany signed on to shut its nuclear plants and go reactionary with so called renewable energy, the highest reading of that year was recorded for the week beginning April 26, 2000: 372.42 ppm.
Twenty-one years, almost 50 ppm higher! And you know what, the rate of increases in carbon dioxide is accelerating, not decelerating.
Sorry Benny Boy, but the time for so called "renewable energy" to shit or get off the pot was decades ago. It didn't. In fact, there is a reason it was abandoned in the 19th century. You ought to look it up. It's way too fucking late for more "scenarios." All the money in the world is not going to make so called "renewable energy" work. Maybe, just maybe, it's beginning, slightly, to seep in, I did see the Benny Boy paper about how we could "just" mine the ocean floor for metals because so called "renewable energy" might use up all those on land.
To wit:
Sovacool et al., Science 03 Jan 2020: Vol. 367, Issue 6473, pp. 30-33 (Sustainable minerals and metals for a low-carbon future.)
One would have to be completely out one's fucking mind to write something quite so delusional. You're going to mine the ocean floor powered by the sun and the wind only?
Out of your fucking mind...
This would be a good time to start thinking Benny boy, not that I expect it, since I've been suffering your insufferable ignorance for a long time.
Ignorance kills people; since 2013, again, about 50 million of them, all dead because we didn't commit to going nuclear, long ago, as Hansen suggested we should have done long ago, by appeal to historical data.
If I sound angry, it's because I am.
Have a pleasant Sunday.
Magnetic Separation Method for Isolating Rare-Earth Elements and Zirconium from Molten Salts
The paper to which I'll briefly refer is this one, published by Russian scientists in an English edition: Alekseeva, L.S., Savinykh, D.O., Orlova, A.I. et al. Magnetic Separation Method for Isolating Rare-Earth Elements and Zirconium from Molten Salts. Inorg Mater 56, 583–590 (2020).
Strontium ferrites are magnetic particles that find utility in many electronic storage devices. This paper uses magnetic particles that are also strontium based, particles which apparently have a Curie Point higher than the temperature of molten salts.
From the introduction:
Extraction of actinides (Am and Cm), rare-earth elements (REEs), and zirconium from melts is one of the key issues in this technology, in particular in Russia [5, 6, 24, 25].
Extraction, preconcentration, and consolidation methods under development for subsequent isolation of actinide fission products from the biosphere include precipitation, ion exchange, zone crystallization, and sorption.
In this work, we propose using a magnetic field for extracting components dissolved in a LiCl–KCl melt.
Actinide- and rare-earth-containing strontium hexaferrite with the magnetoplumbite structure and zirconium-containing spinel ferrites are of interest as magnetic carriers capable of absorbing melt components to be extracted.
The authors synthesized spinel magnetic ferrite particles isomorphous with a magnetic mineral containing lead, magnetoplumbite. They noted that many of the compounds in this class of isomorphs can incorporate lanthanide elements (aka "rare earths."

However their spinel structure was a compound, again isomorphous, of strontium, copper, iron and oxygen.
They heated a molten salt composed of potassium and lithium chloride at 450C and were able to extract neodymium and zirconium.
It was hardly quantitative according to a table in the paper:
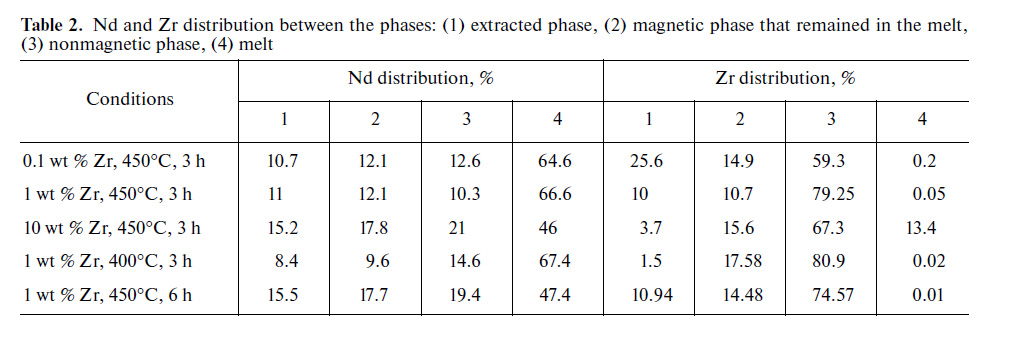
There are lots of people who are molten salt reactor kind of guys and gals; I used to be one myself, but I changed my mind. However, in recent years I have begun to rethink molten salts in all kinds of chemical separations processes, and redox processes, including but not limited to separation and recovery of valuable materials in used nuclear fuels. (It should be noted that there are an infinite number of molten salts, given the existence and wide study of "ionic liquids" some of which are partially or wholly organic molecules.
I'm not sure this work has much practical import, although one can imagine these things in certain kinds of molecular filters, but any magnetic material with a curie point high enough to be stable in a molten alkali metal salt is interesting. For the record, I do not favor the use of potassium salts in nuclear fuel settings since the separation from cesium is problematic. Rubidium, which is present mostly in a form (Rb-87) that occurs naturally all over the planet as a fission product is a better choice.
I trust you're having a nice Saturday.
I would say there's a especially wonderful "Greatest Threads" list today.
At a small country churchThe doc is right
Calling my son a big fat chicken worked!
posted on jill biden's twitter yesterday (and i love this picture!)
"Let them stand up in the well of the floor, put on some Depends, let their feet bleed or whatever"
I found them uplifting: family, courage, honesty, strength...
I added a rec to each.
Thermoelectric Power Generation and Water Stress in India: A Spatial and Temporal Analysis
The paper I'll discuss in this brief post is this one: Thermoelectric Power Generation and Water Stress in India: A Spatial and Temporal Analysis (Chao Zhang, Joonseok Yang, Johannes Urpelainen, Puneet Chitkara, Jiayi Zhang, and Jiao Wang Environmental Science & Technology 2021 55 (8), 4314-4323).
The connection between water and energy, particularly in an electrified world is inexorable.
It is worth noting (or confessing?) that the form of electrical energy (and other) energy that I regard as sustainable and environmentally acceptable, nuclear energy, is the worst offender for the use of water for power generation, at least as presently practiced. I am convinced that this problem can be engineered away, but it has not, as of now, been engineered away.
The paper under discussion is an overview of the water situation in India, a developing nation now undergoing a terrible Covid tragedy for which all decent human beings must extend sympathy and where possible aid. This said, the long term, environmental tragedy of India may make Covid pale in the end. For this reason, this paper, a policy paper, is worth some consideration.
From the introduction:
Among different sources of energy, thermoelectric power is of central importance in this regard. Thermoelectric power generation constitutes 75% of the world’s net electricity generation(9) and has been the largest source of water withdrawal (86%) in the energy sector.(10) In recent years, a growing number of studies have investigated the relationship between thermal power generation and water scarcity in different countries and regions, including the United States,(11,12) the United Kingdom,(13) Middle East and North Africa,(14) South Africa,(15) and developing countries in Asia.(16)
Particular attention has been paid to China, where the thermal power industry has grown rapidly and water scarcity is a significant environmental challenge.(17?19) Existing studies have investigated various aspects of the electricity-water nexus in China, such as estimating aggregate water use by thermal power generation based on top-down data and methodologies (e.g., refs (20and21)); compiling spatial explicit water use inventories and water stress maps through bottom-up data at the power plant or generating unit-level (e.g., refs (22?25)); accounting for virtual water transfers via inter-regional or interprovincial electricity transmission (e.g., refs (26?29)); and projecting future trajectories of water use by using scenario analysis tools or energy system modeling (e.g., refs (30?32)). These analyses have revealed numerous spatial and temporal characteristics of the electricity-water nexus in China. Of note are the impacts in the water sector due to technological changes and policy interventions in the power sector. For example, historical analysis that is based on a detailed unit-level water use inventory conducted by ref (23) shows that thermal power generation in catchments under high water stress (with a water withdrawal-to-availability ratio greater than 0.4) has grown by a factor of 4.5 from 2000 to 2015 (from 643 TWh in 2000 to 2,885 TWh in 2015). At the same time, significant policy-induced technological changes, especially those in cooling technology structures, have successfully decoupled thermoelectric freshwater withdrawal from growing power generation.
Thermal power generation, especially coal-fired power, also plays a major role in India’s electricity mix. Driven by a growing population and economic development, India’s generation capacity is being rapidly expanded. Projections estimate that energy demand in India will increase by 1005 Mtoe from 2016 to 2040, more than any other country during the same period.(33) India is also projected to have the largest population increase worldwide, and will surpass China as the world’s most populous country in 2027...(34)
The paper notes that water scarcity is a huge problem in India as well as in China, and in fact, pretty much everywhere in the world. The failure to make even a weak stab at addressing climate change - all of our fantasies about electric cars, vast wind industrial parks in former wildernesses, and electric generating glass coated with millions of tons of mined, carbon reduced, and often toxic elements of the periodic table have done nothing at all except generate more fantasies - will make this worse.
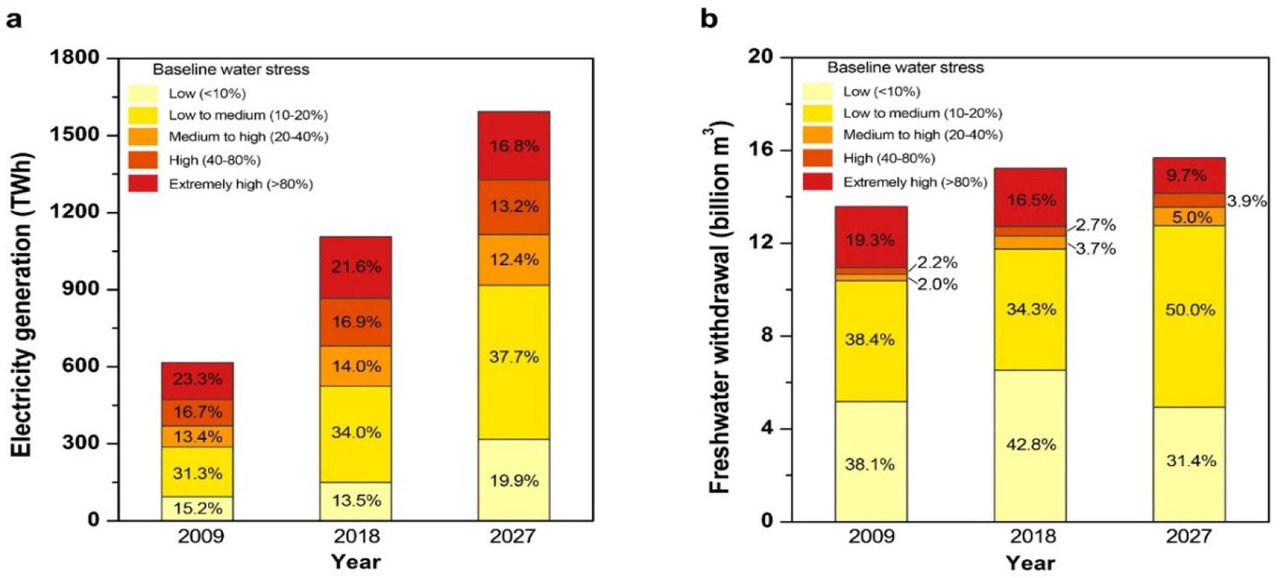
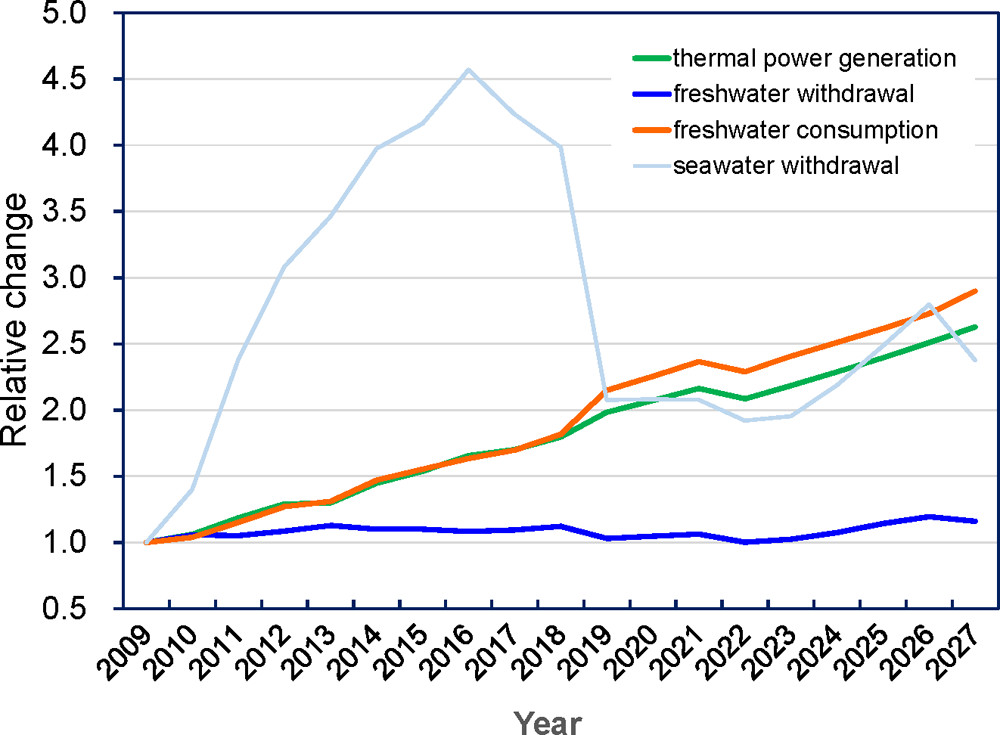
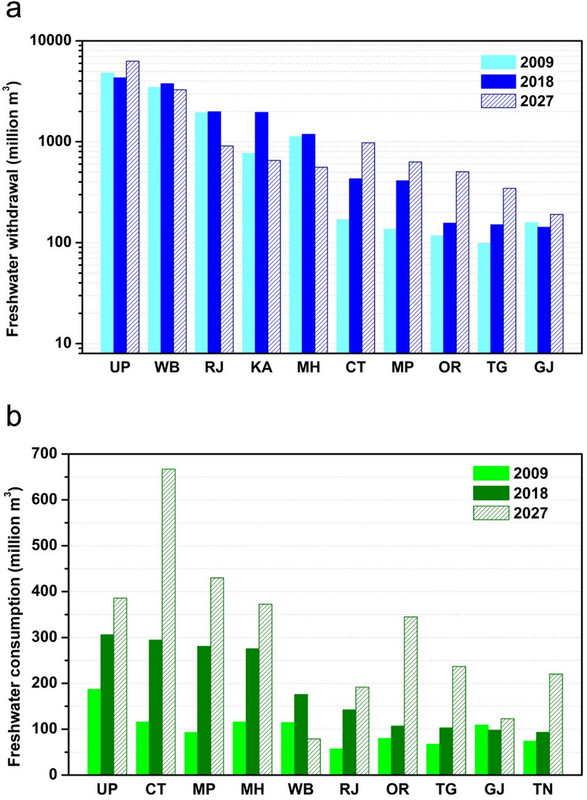
The story can be told in graphics and tables from the paper:
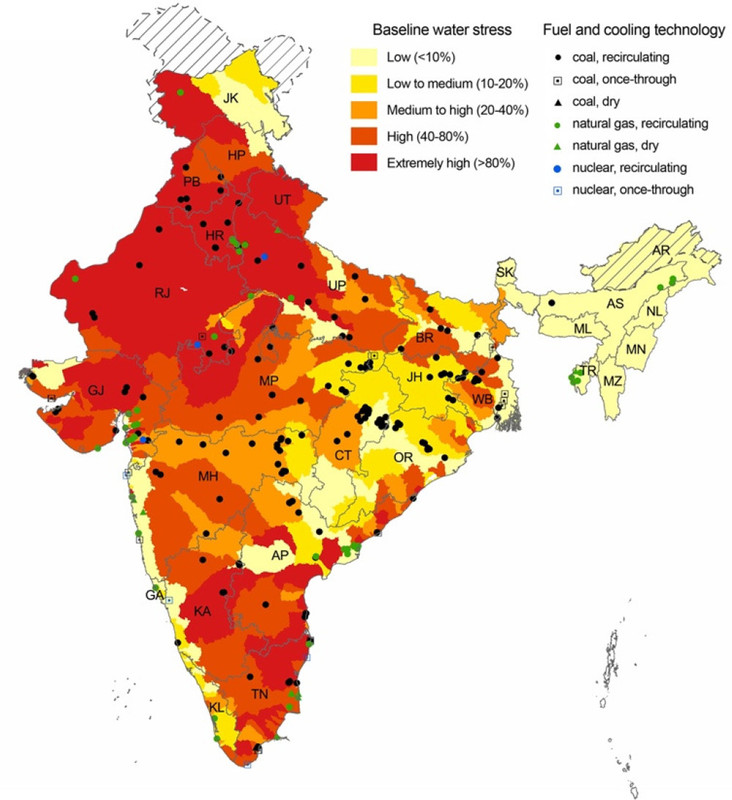
The caption:
The caption:
The caption:
The caption:

The caption:
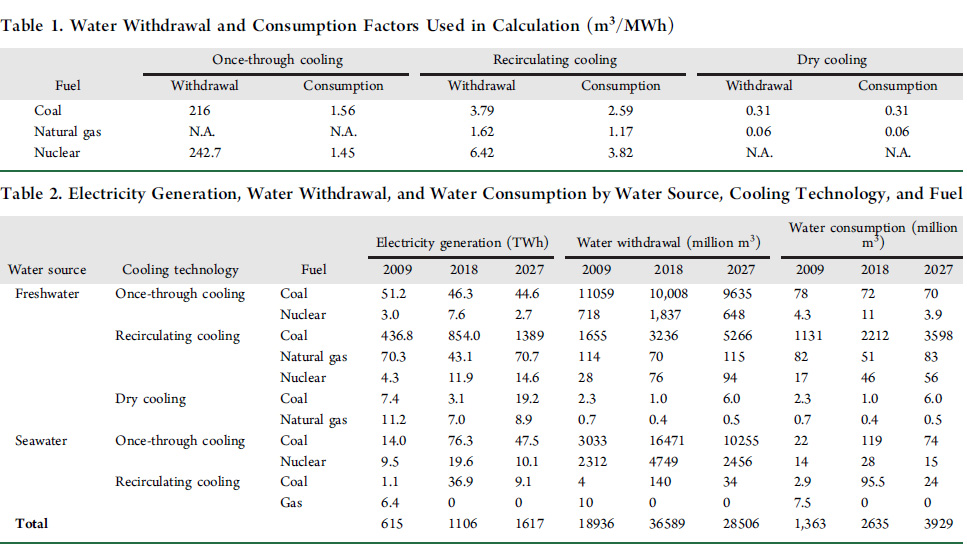
Some tables from the text:
Some additional text, which is involved with something called "reality:"
Net electricity generation increased by around 80% from 615 TWh in 2009 to 1106 TWh in 2018. The role of coal-fired power generation grew during the past decade, and it contributed to 92% (1017 TWh) of total thermal power generation in 2018, compared to 83% (615 TWh) in 2009. The lack of natural gas resources in India has impeded the development of natural gas-fired power generation. Although the installed capacity of natural gas-fired power plants rose during the study period, electricity generation decreased 43% from 88 TWh to 50 TWh. Nuclear power contributed to around 3.5% of overall generation.
It is often represented in our modern fantasies that "coal is dead" coupled with the stupid remark that the reason "coal is dead" is because of so called "renewable energy." It is telling however, and a dose of reality in the face a delusion every bit as serious - in some ways worse - that Covid is a "hoax," that coal is not dead where there is no ready access to dangerous natural gas, the use of which will scar the planet's atmosphere, water and land for eternity, all for short term comfort. This fact is highlighted in text I have bolded in this text just above. So called "renewable energy" did not save the world, is not saving the world, and will not save the world. It is a trivial form of energy, completely dependent on access and use of dangerous natural gas, and all the denial in the world will not change this fact.
Facts matter.
Nevertheless, there is discussion in the text of solutions with an eye of chasing the chimera that so called "renewable energy" is sustainable, even though one of the features of escaping poverty - poverty being an issue in India - is the abandonment of trying to survive on so called "renewable energy." This de facto discussion is here:
Whatever. The italics are mine.
India has huge thorium resources, and it has now supplanted Canada in the use of CANDU type heavy water nuclear reactors. It has also piloted a plant for the extraction of uranium from seawater.
Ironically enough - I've discussed this topic many times elsewhere - the solution to water demands for power plant cooling is ironically enough, to raise the internal temperatures so as to drive heat networks that extract additional work (exergy) from that heat, i.e. raise the efficiency of the plants to unprecedented methods. One possible inclusion in a heat network are systems that desalinate sea water. Desalination is not a panacea, and many environmental issues need to be addressed to employ it, but I believe they can be addressed by an educated, dedicated and respectful version of humanity, one not here immediately, but one that is certainly possible.
We are at a cross roads.
The functional "renewables will save us," anti-nuke guru who resides in a super energy efficient aerie on a mountain in the wealthy enclave of Snowmass, Colorado - which is represented in congress by Lorena Bobbitt, delusional gun nut Trump humper - is Amory Lovins. Amory Lovins will tell you that the goal of energy efficiency is to reduce the use of energy. Of course, Amory Lovins couldn't care less about poor people.
Maybe delusion is contagious in Snowmass.
I am disinterested in delusional bourgeois brats. Unlike the guru in Snowmass I am familiar with Jevon's paradox, well known and often observed since the 19th century, which states that increases in energy efficiency increase the use of energy. I'm fine with that because I believe that sustainable energy is possible. For me increases in efficiency are all about making energy available to the billions of people who lack it, a significant portion of whom live in India.
Have a nice weekend.
Global groundwater wells at risk of running dry
The paper I'll discuss in this post is this one: Global groundwater wells at risk of running dry (BY Scott Jasechko and Debra Perrone Science 372, 418–421 (2021) 23 April 2021)
A news item referring to the paper in the same issue of Science which is likely to be open sourced is here: The hidden crisis beneath our feet (James S. Famiglietti1,2, Grant Ferguson, Science 23 Apr 2021: Vol. 372, Issue 6540, pp. 344-345)
If memory serves me well, I have referred a number of times to a lecture I attended by Dr. Robert Kopp of Rutgers University, this one: Science on Saturday: Managing Coastal Risk in an Age of Sea-level Rise, wherein, in answer to a question from the audience (mine), Dr. Kopp explained that about 10% of sea level rise can be attributed to water pumped out of the ground and allowed to evaporate. Most of this water is used for agriculture, but it is also used in cities and in homes. I am guilty here. The water in my home is well water, which as I happen to know, contains some interesting and unpleasant substances.
This suggests - I've been musing about this a lot lately - that one path to addressing climate change would be restoring shorelines would include refilling the aquifers we've drained in the last 50 years or so in yet another expression of our accelerating contempt for all future generations, along with dried up lakes like Owens Lake in California, and dying bodies of water like Lake Baikal, the Aral Sea, the Caspian Sea, etc...
My most recent episode of such musings out loud is here: Ion-capture electrodialysis using multifunctional adsorptive membranes, which is preceded by a long dull digression on reactor physics and the mercury content of the oceans.
To anyone who argues that refilling ground water by desalination of ocean water, refilling dead lakes, dead seas etc. is geoengineering, let me say this.
There is a television show on the Science channel called Engineering Catastrophes which I watch from time to time to give me ammunition to make fun of my son the engineer. It's all about failures of bridges, buildings, roadways, etc. from things like hydrogen embrittlement, improper analysis of stresses, poor materials etc. However everything on this show is small potatoes compared to the biggest engineering catastrophe, the existing haphazard, uncontrolled and unplanned geoengineering of the entire planet, most of which has been a catastrophe of the last one hundred years.
This is not really a water problem; it is an energy problem. No, wind turbines in lobster fisheries off the coast of Maine, nor any other wind schemes designed to industrialize wilderness, will not produce even a fraction of the energy required owing to thermodynamic, mass intensity, reliability and lifetime considerations. The sooner we lose our affection for this nonsense, the more hope we will have.
The goal of geoengineering should be to restore, and nothing more.
Anyway future generations are in a world of hurt according to this paper. From the paper's introduction:
When groundwater wells run dry, one common adaptation strategy is to construct deeper wells (11). Deeper wells tend to be less vulnerable than shallower wells to climate variability (12) and groundwater level declines (13), but even relatively deep wells are not immune to long-term reductions in groundwater storage. Despite the role of wells as a basic infrastructure used to access groundwater, information about the locations and depths of wells has never before been compiled and analyzed at the global scale. Analyzing groundwater resources at the global scale is becoming increasingly important because of groundwater’s role in virtual water trade, international policy, and sustainable development (14, 15). Nevertheless, we emphasize that groundwater is a local resource influenced by hydrogeologic conditions, water policies, sociocultural preferences, and economic drivers.
Here, we compiled ~39 million records of groundwater well locations, depths, purposes, and construction dates (supplementary materials section S1), which provide local information at the global scale. These observations promote a better understanding of spatiotemporal patterns of well locations and depths (16, 17). Groundwater data are notoriously difficult to collect and collate (18, 19). The ~39 million wells are situated in 40 countries or territories that represent ~40% of global ice-free lands (average data density of 0.7 wells/km2; Fig. 1). Half of all global groundwater pumping takes place within our study countries or territories [fig. S2, reference (2), and supplementary materials section S5.1], which are home to >3 billion people (table S1).
Fig. 1 Groundwater well depths in countries around the globe.

The caption:
The dataset contains ~39 million wells in 40 countries or territories (see inset map). Blue points mark shallower wells and red points mark deeper wells in Canada, the United States (white areas mark states where data are unavailable), and Mexico (A); Argentina (partial coverage), Bolivia (partial coverage), Brazil, Chile, and Uruguay (B); Iceland, Portugal, Spain, France, Germany (partial coverage), Denmark, Sweden, Norway, Italy, Slovakia, Slovenia, Belgium, Poland, Latvia, Estonia, Czech Republic, Hungary, United Kingdom, and Ireland (C); Namibia and South Africa (D); Thailand and Cambodia (E); and Australia (F). National-level analyses are available in figs. S37 to S435.
Fig. 2 Fraction of areas with deeper well drilling versus shallower well drilling for five time periods among study countries.

The caption:
Well-deepening trends are more common than well-shallowing trends for the majority of time periods for the majority of countries (national-level analyses in figs. S37 to S435). (A) The fraction of 100 km by 100 km study areas where wells are being drilled deeper over time (Spearman ? > 0; regression of well completion depth versus well construction date). Each diamond represents well construction depth variations over time for a given country (e.g., blue diamonds are regressions for years 2000–2015; see legend above figure); some points overlap. (B to L) Spearman ? determined by regression of well depth versus construction date for the time interval 2000–2015 in 11 countries [i.e., the fraction of all 100 km by 100 km areas in these maps with Spearman ? > 0 correspond to the blue diamonds in (A)]. Blue shades mark 100 km by 100 km areas where wells are being constructed shallower over time (i.e., Spearman ? < ?0.1); orange and red shades mark 100 km by 100 km areas where wells are being constructed deeper over time (i.e., Spearman ? > 0.1.)
Fig. 3 Well construction depth trends at locations close to ( 0) significantly (Spearman P < 0.05) over time.

The caption:
An excerpt of the conclusion of this short paper:
...Groundwater wells supply water to billions of people around the globe (2, 13, 14, 36). Groundwater depletion is projected to continue in some areas where it is already occurring, and even expand to new areas not yet experiencing depletion (37)...
...Our work highlights the vulnerability of existing wells to groundwater depletion because (i) many wells are not much deeper than the local water table, making them likely to run dry with even modest groundwater level declines (supplementary materials section S6), and (ii) deeper well construction is common but not ubiquitous where groundwater levels are declining...
History will not forgive us, nor should it.
Have a nice weekend.
A day in the life.
The rate of denovo genetic mutations in the children of parents exposed to Chernobyl radiation.
The paper I'll discuss in this post is this one: Lack of transgenerational effects of ionizing radiation exposure from the Chernobyl accident M. Yeager et al., Science 10.1126/science.abg2365 (2021).
This week marks the 34th anniversary of the steam explosion at the Chernobyl Nuclear Power Plant. The graphite moderator in plant burned for weeks and much of the inventory of volatile fission products was released into the environment, and detected in easily measurable amounts all across Europe, as far away as Scotland.
This event garnered huge attention at the time and still garners significant attention.
It is reported that about six to seven million people die each year from air pollution, meaning that about 200-250 million people have died from air pollution since the explosion of the nuclear reactor, proving in the minds of many that nuclear power is "too dangerous," while apparently the combustive use of fossil fuels and biomass, responsible for these 200-250 million deaths, is not "too dangerous." Neither is climate change "too dangerous." These facts, deaths from air pollution, and the acceleration of climate change despite endless talk about and expenditures on so called "renewable energy," unlike Chernobyl do not garner huge attention.
Go figure.
From the introduction to the paper:
Only recently has it been feasible to comprehensively investigate DNMs genome-wide at the population level in humans by whole-genome sequencing (WGS) of mother/father/child trios. Recent reports of human DNMs characterized by WGS of trios estimate between 50 and 100 new mutations arise per individual per generation (2, 4–8), consistent with the population genetic estimate that the human mutation rate for single-nucleotide variants (SNVs) is approximately 1×10?8 per site per generation (9, 10). The strongest predictor of DNMs per individual is paternal age at conception (2–6, 8) with an increase of 0.64-1.51 per one-year increase in paternal age (6, 8, 11) while a maternal effect of approximately 0.35 per one-year increase in age was observed (6, 8, 12). Transgenerational studies of radiation exposure have primarily focused on disease (cancer, reproductive, and developmental) outcomes and have reported inconclusive results (13, 14).
Exposure to ionizing radiation is known to increase DNA mutagenesis above background rates (15, 16). Animal and cellular studies suggest high doses of ionizing radiation can lead to DNMs in offspring, particularly through double-stranded breaks (13, 17). Human studies have sought a biomarker of prior radiation injury (13, 18, 19), but have examined a small number of minisatellites and microsatellites, yielding inconclusive results (20–23). A WGS study of three trios from survivors of the atomic bomb in Nagasaki did not reveal a high load of DNMs (20), while a single-nucleotide polymorphism (SNP) array study of 12 families exposed to low doses of Caesium-137 from the Goiania accident in Brazil reported an increase in large de novo copy-number variants (24). No large comprehensive effort has explored DNMs genome-wide in children born from parents exposed to moderately high amounts of ionizing radiation yet possible genetic effects have remained a concern for radiation-exposed populations, such as the Fukushima evacuees (25).
Herein, we examine whether rates of germline DNMs were elevated in children born to parents exposed to ionizing radiation from the 1986 Chernobyl (Chornobyl in Ukrainian) disaster, where levels of exposure have been rigorously reconstructed and well-documented (26). Our study focused on children born of enlisted cleanup workers (“liquidators”) and evacuees from the town of Pripyat or other settlements within the 70-km zone around Chernobyl Nuclear Power Plant in Ukraine (27) after the meltdown, some of whom had extremely high levels of radiation exposure and several of whom experienced acute radiation syndrome. We performed Illumina paired-end WGS (average coverage 80X), SNP microarray analysis, and relative telomere length assessment on available samples from 130 children from 105 mother-father pairs. The parents had varying combinations of elevated gonadal ionizing radiation exposure from the accident (tables S1 to S3), and included a combination of exposed fathers, exposed mothers, both parents exposed and neither parent exposed (27)...
Some figures from the paper:

The caption:
Analyses are presented by increasing paternal and maternal age at conception, paternal and maternal dose, birth year of child, and paternal and maternal smoking at conception. All plots are univariate and do not account for other potentially correlated variables (for example, maternal age does not account for high correlation with paternal age).

The caption:
n = number of children sequenced (adapted from (39)). Liftover was used to convert coordinates to hg38 for all studies and the reference for CpG sites were defined with respect to that reference sequence. Only autosomes were included. Error bars show binomial 95% confidence intervals. Studies included Kong (2); Wong (8); Francioli (4); Michaelson (3); Jónsson (6); and Chernobyl (present study).
Some additional text:
Our study evaluated peripheral blood from adult children conceived months or years after the Chernobyl accident, which limited the ability to assess exposure closer to conception; however, there was no evidence of notable differences in DNMs in children born the following year (1987). Since these families were recruited several decades after the accident, we acknowledge potential survivor bias among sampled children, although this is unlikely since there is no consistent demonstration in humans of sustained clinical effects of preconception ionizing radiation exposure (36)...
....Although it is reassuring that no transgenerational effects of ionizing radiation were observed in adult children of Chernobyl cleanup workers and evacuees in the current study, additional investigation is needed to address the effects of acute high-dose parental gonadal exposure closer to conception. The upper 95% confidence bound suggests the largest effect consistent with our data is 1 Gy), but lower maternal dose was not associated with elevated DNMs, consistent with animal studies (13). Furthermore, our analysis of 130 adult children from 105 couples using 80X coverage of short-read technology suggests that if such effects on human germline DNA occur, they are uncommon or of small magnitude. This is one of the first studies to systematically evaluate alterations in human mutation rates in response to a man-made disaster, such as accidental radiation exposure. Investigation of trios drawn from survivors of the Hiroshima atomic bomb could shed further light on this public health question
For the record, I am an older father, and therefore there is a higher probability that my sons have DNM's than there may be to the children of men who were younger than I was before coming a father. If so these were happy mutations, since my sons are better men than I was at their age. I love my mutant boys.
Have a nice day tomorrow.
Profile Information
Gender: MaleCurrent location: New Jersey
Member since: 2002
Number of posts: 33,516