Welcome to DU!
The truly grassroots left-of-center political community where regular people, not algorithms, drive the discussions and set the standards.
Join the community:
Create a free account
Support DU (and get rid of ads!):
Become a Star Member
Latest Breaking News
General Discussion
The DU Lounge
All Forums
Issue Forums
Culture Forums
Alliance Forums
Region Forums
Support Forums
Help & Search
pbmus
pbmus's Journal
pbmus's Journal
January 31, 2015
Land moving upward faster than researchers expected at 1.4in every year, allowing ‘hot potato’ rocks to rise
http://www.theguardian.com/environment/2015/jan/30/climate-change-lifting-iceland-volcanic-eruptions
I am not a scientist, BUT
Climate change is lifting Iceland – and it could mean more volcanic eruptionsLand moving upward faster than researchers expected at 1.4in every year, allowing ‘hot potato’ rocks to rise
http://www.theguardian.com/environment/2015/jan/30/climate-change-lifting-iceland-volcanic-eruptions
January 29, 2015
http://www.pewinternet.org/2015/01/29/public-and-scientists-views-on-science-and-society/
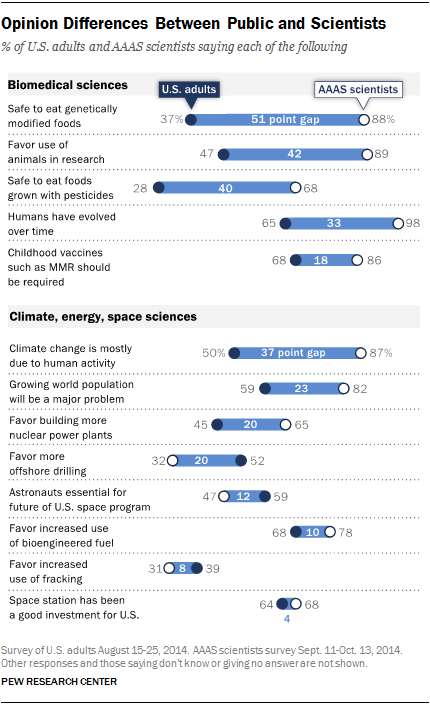
WTF ...193
Opinion Differences Between American Public and Scientistshttp://www.pewinternet.org/2015/01/29/public-and-scientists-views-on-science-and-society/
January 29, 2015

http://www.motherjones.com/tom-philpott/2015/01/noaa-globes-coral-reefs-face-massive-bleaching-event-2015
I am not a scientist, BUT
Something Really, Really Terrible Is About to Happen to Our Coralhttp://www.motherjones.com/tom-philpott/2015/01/noaa-globes-coral-reefs-face-massive-bleaching-event-2015


January 29, 2015
If you have a hard time visualizing climate change, here’s how our planet is faring.
http://www.buzzfeed.com/kasiagalazka/nasa-earth-vitals#.fgapwkvyP
I am not a scientist, BUT
6 GIFs That Show The State Of EarthIf you have a hard time visualizing climate change, here’s how our planet is faring.
http://www.buzzfeed.com/kasiagalazka/nasa-earth-vitals#.fgapwkvyP
January 29, 2015
I am not a scientist, BUT
January 29, 2015
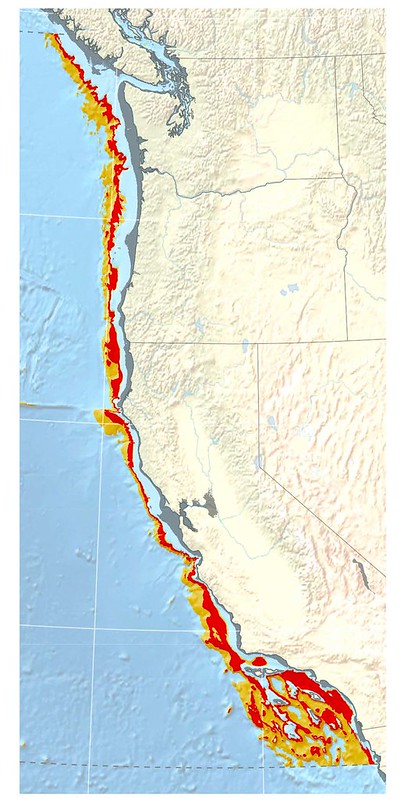
This map of the California Current shows the extent of the low-oxygen seafloor. Yellow indicates intermediate hypoxia, while red zones are areas of severe oxygen loss. UC Davis
http://www.theverge.com/2015/1/28/7930047/climate-change-could-mean-massive-ocean-dead-zones
http://journals.plos.org/plosone/article?id=10.1371/journal.pone.0115246
I am not a scientist, BUT
This map of the California Current shows the extent of the low-oxygen seafloor. Yellow indicates intermediate hypoxia, while red zones are areas of severe oxygen loss. UC Davis
http://www.theverge.com/2015/1/28/7930047/climate-change-could-mean-massive-ocean-dead-zones
http://journals.plos.org/plosone/article?id=10.1371/journal.pone.0115246
January 29, 2015
By Tom Randall and Blacki Migliozzi | January 16, 2015
Deny this. The animation below shows the Earth’s warming climate, recorded in monthly measurements from land and sea over 135 years. Temperatures are displayed in degrees above or below the 20th-century average. Thirteen of the 14 hottest years are in the 21st century.
http://www.bloomberg.com/graphics/2014-hottest-year-on-record/
I am not a scientist, BUT
2014 Was the Hottest Year on RecordBy Tom Randall and Blacki Migliozzi | January 16, 2015
Deny this. The animation below shows the Earth’s warming climate, recorded in monthly measurements from land and sea over 135 years. Temperatures are displayed in degrees above or below the 20th-century average. Thirteen of the 14 hottest years are in the 21st century.
http://www.bloomberg.com/graphics/2014-hottest-year-on-record/
Profile Information
Member since: Wed Aug 22, 2012, 08:01 PMNumber of posts: 12,422